Table of Contents
Monitoring & Management
BM-SM and BM-GW collect sensor data for visualization via HTTP interface or HMI. Users can monitor all battery metrics in real-time, configure thresholds, and manage system behavior.
BM-GW WEB UI
- Demo: BTMS BM-GW WEB UI demo
- User: demo
- Pass: demo
Log-in
1st time log in:
- Connect Ethernet 2 port to facility LAN
- Connect PC to Ethernet 1 port (standard Ethernet cable between PC and BM-GW Ethernet 1 port)
- For PC Ethernet connection set fixed IP 192.168.10.200.
- Use the Internet browser to go to https://192.168.10.1
- Log in as:
- user: admin
- password: bmgw!admin
- Check the WAN IP address on the Data center - Settings page and set it if necessary

- Connect the PC to the facility LAN and go to the https://IP address of the WAN port
General description
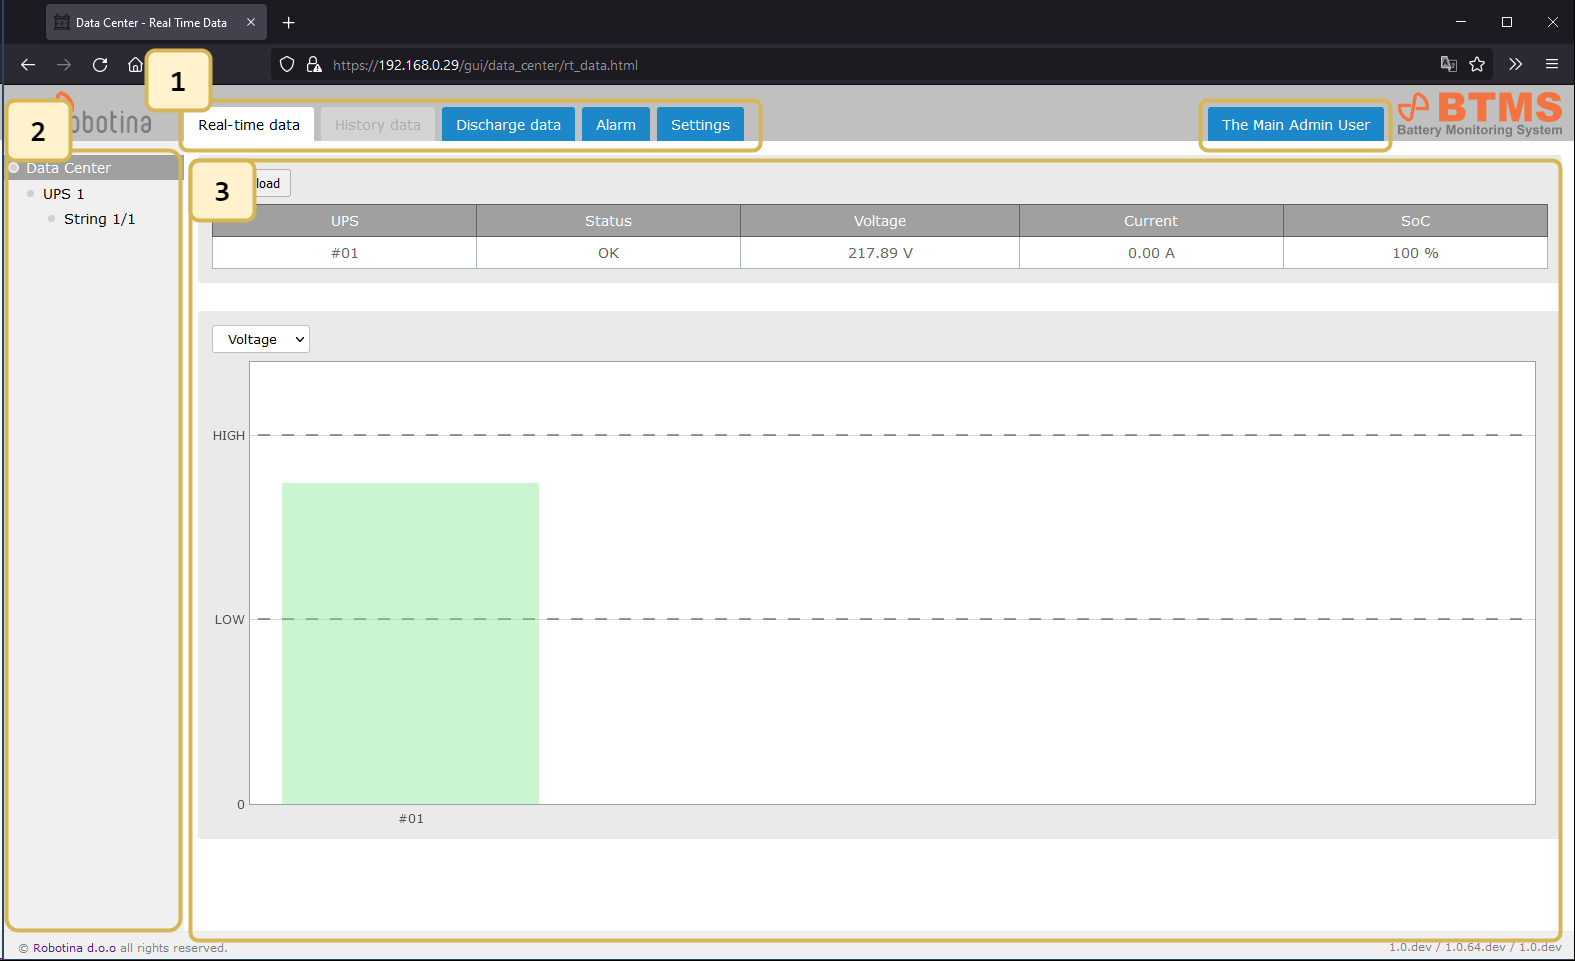
| 1 | Pages tabs |
|---|---|
| 2 | Data center tree structure |
| 3 | Page data |
Data center
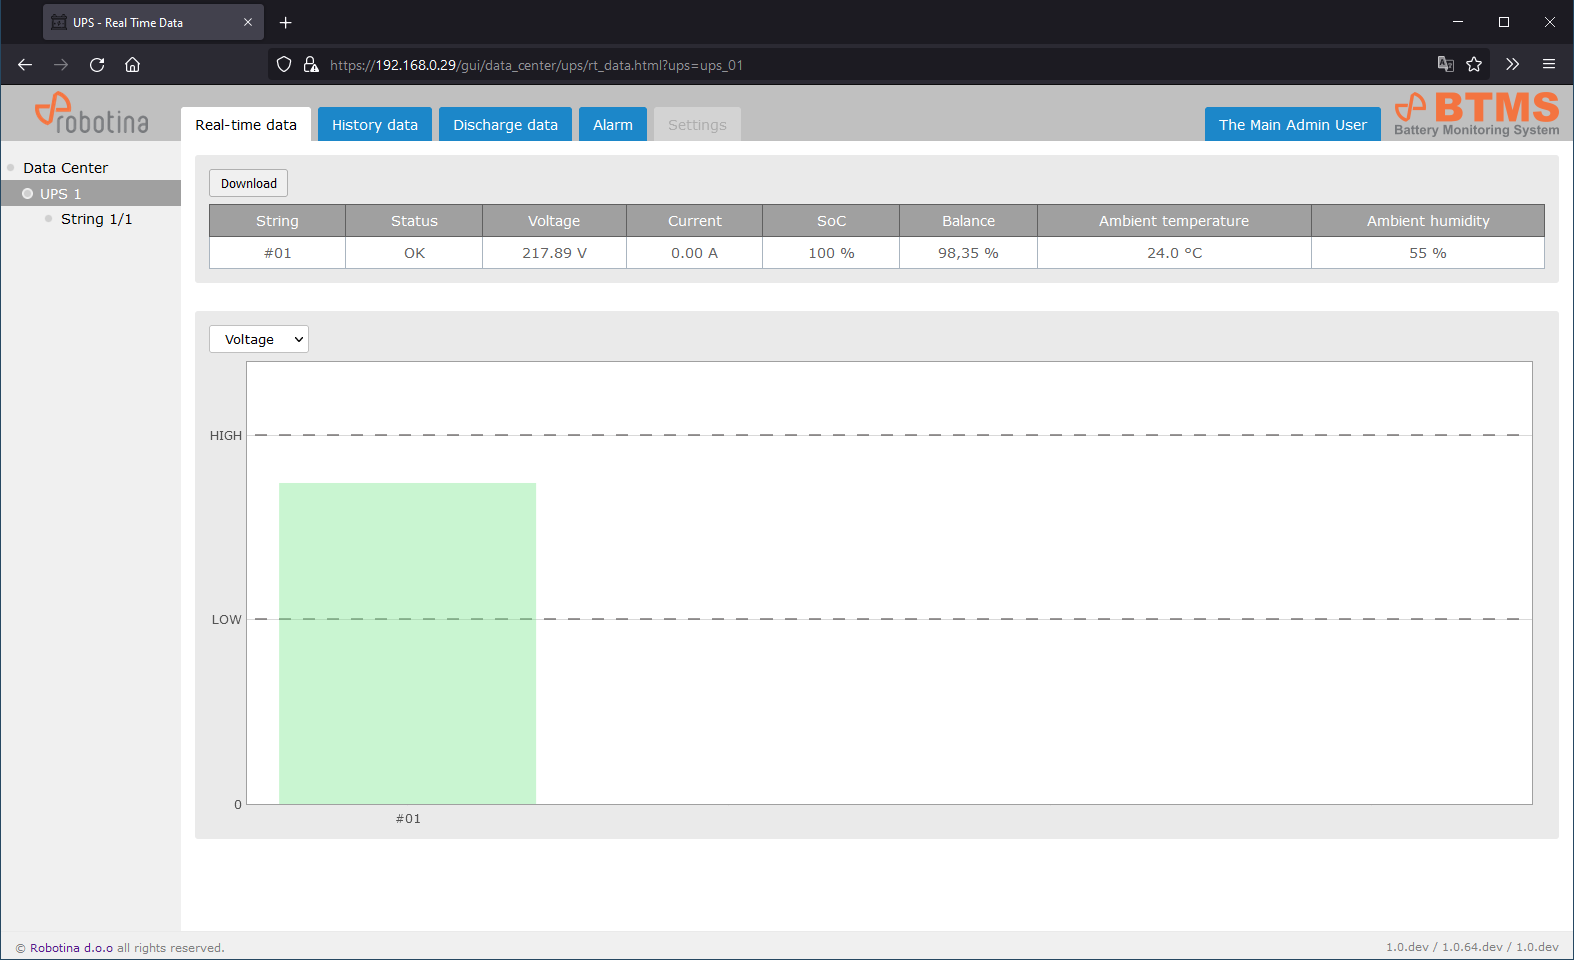
Real-time data
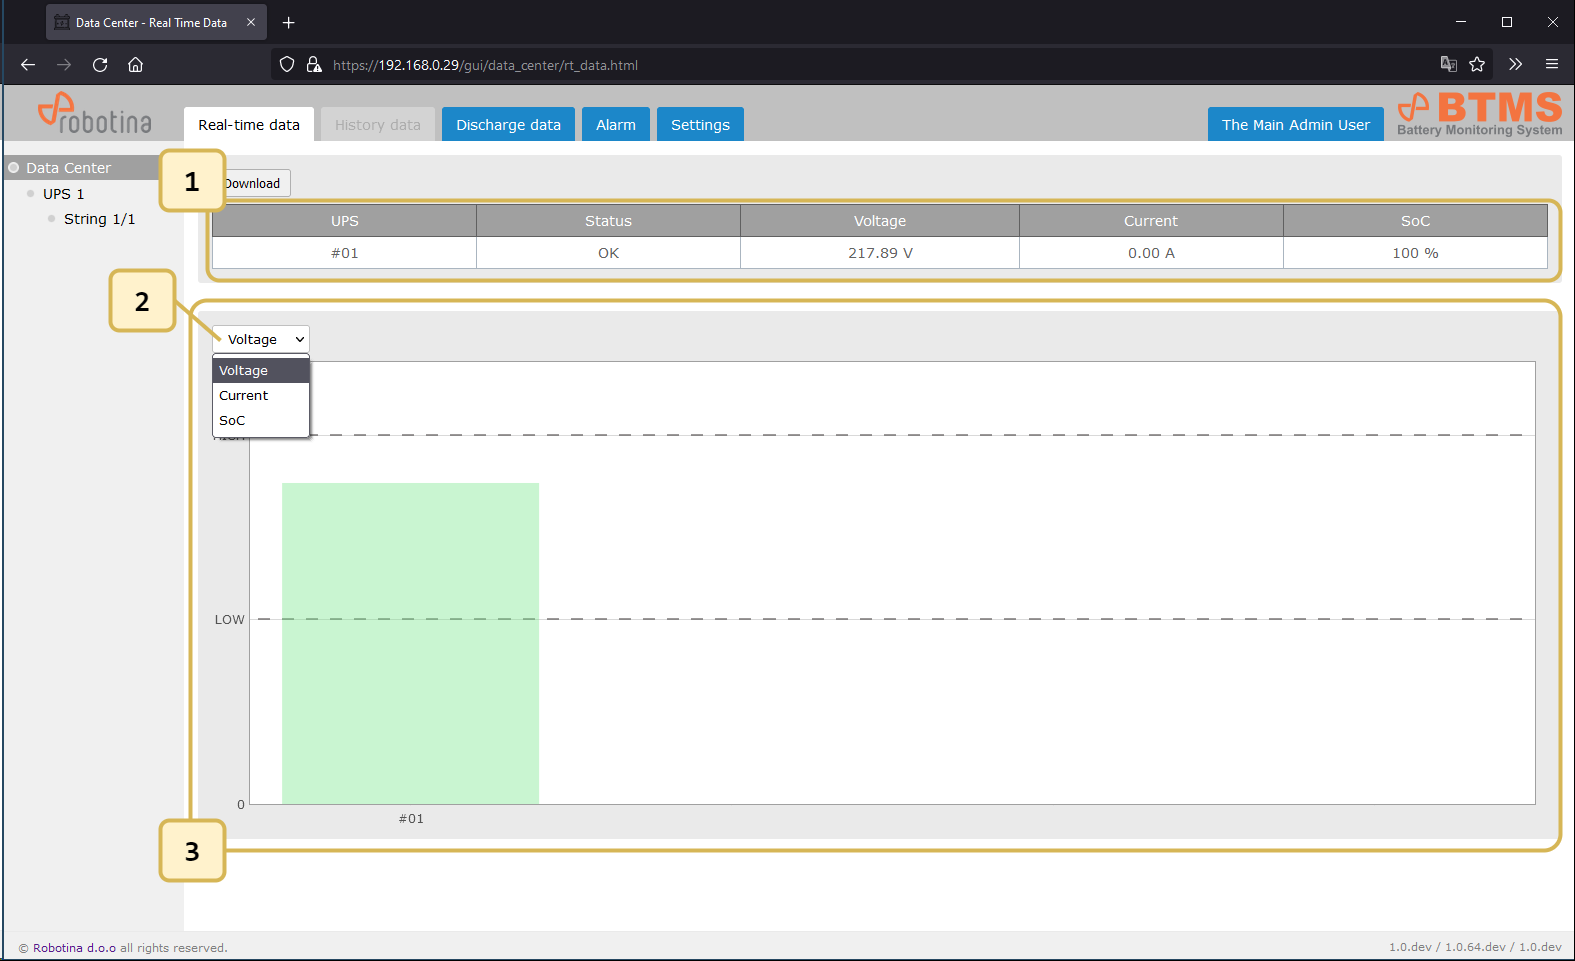
| 1 | Tabular display of data for the Data Center |
|---|---|
| 2 | Select a parameter for the graphic display |
| 3 | Graphic bar-graph data display for the data center |
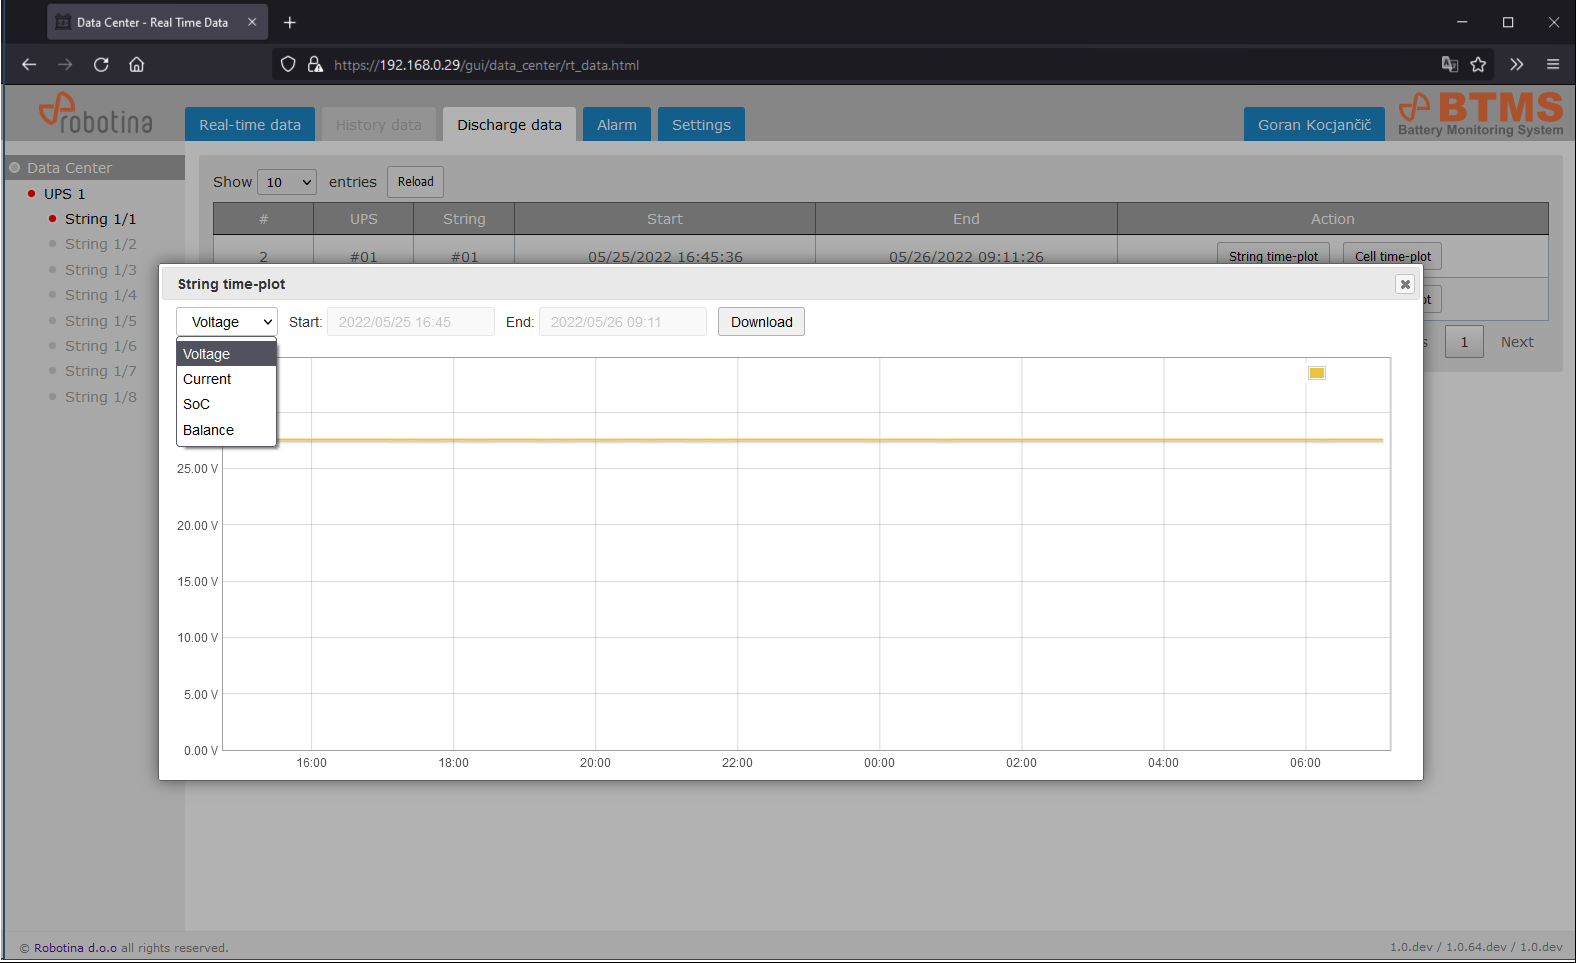
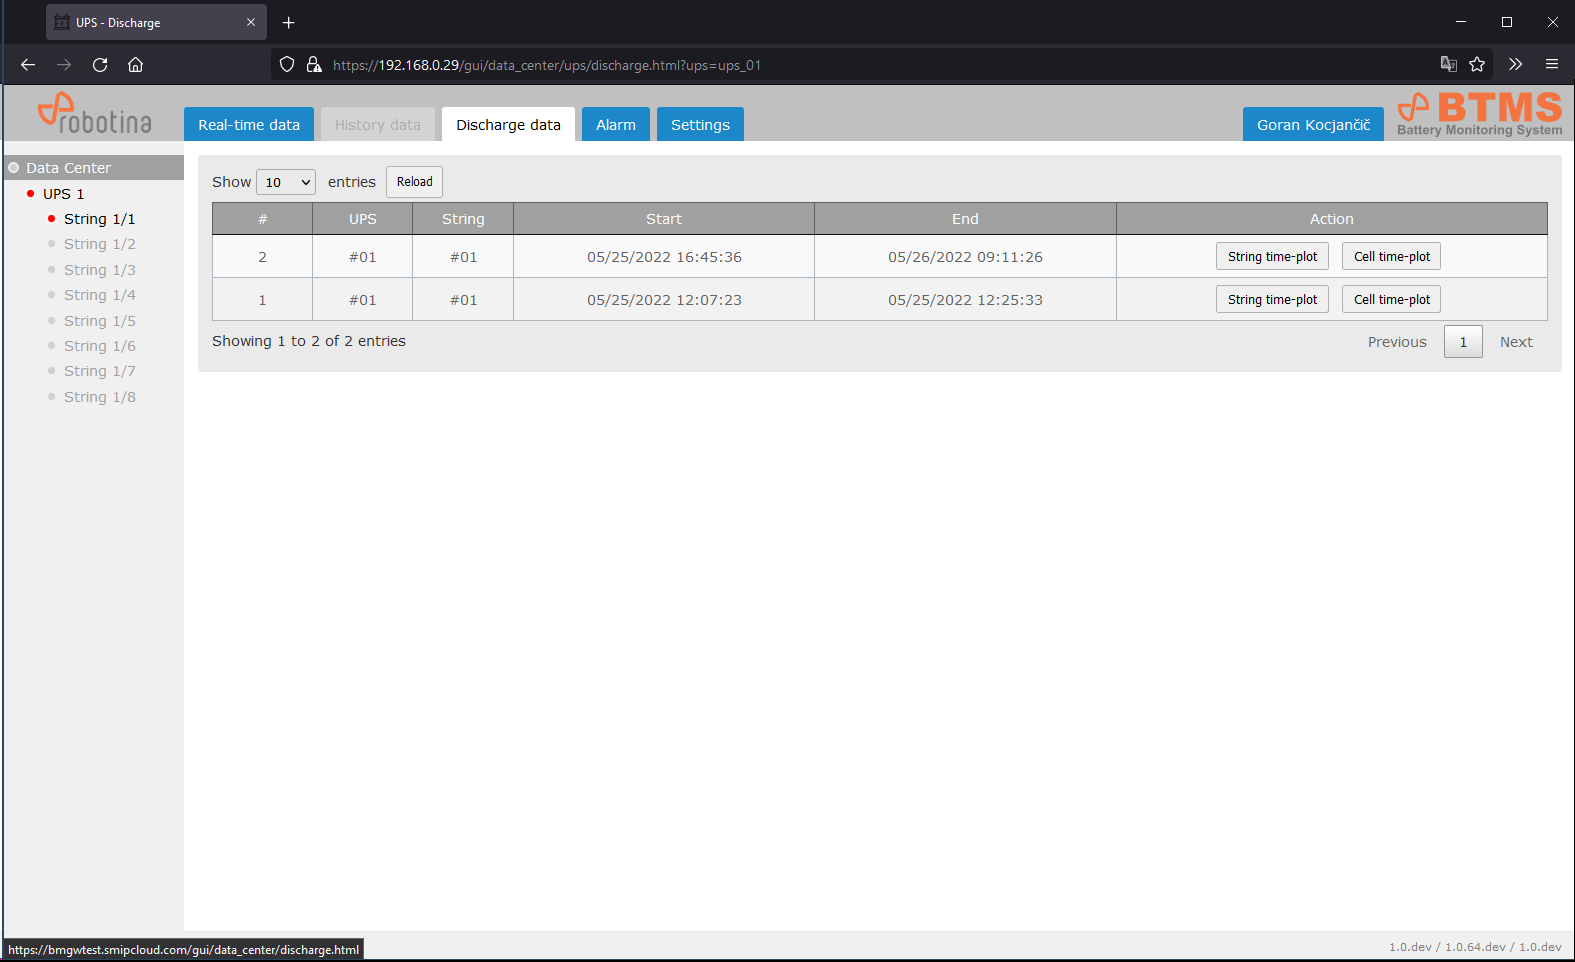
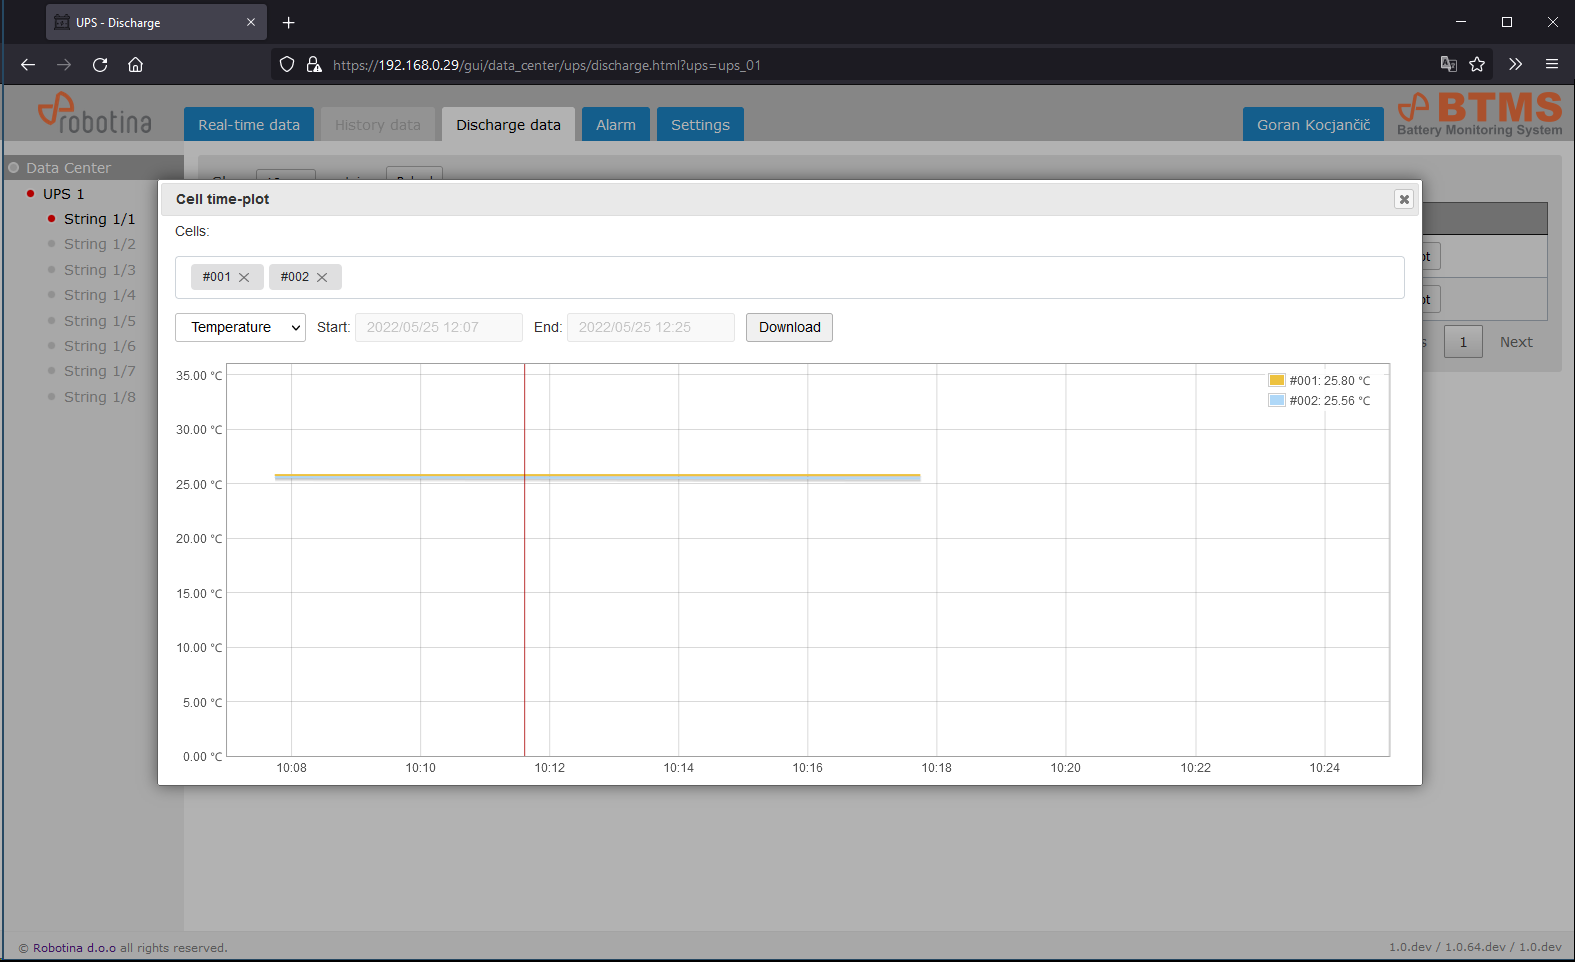
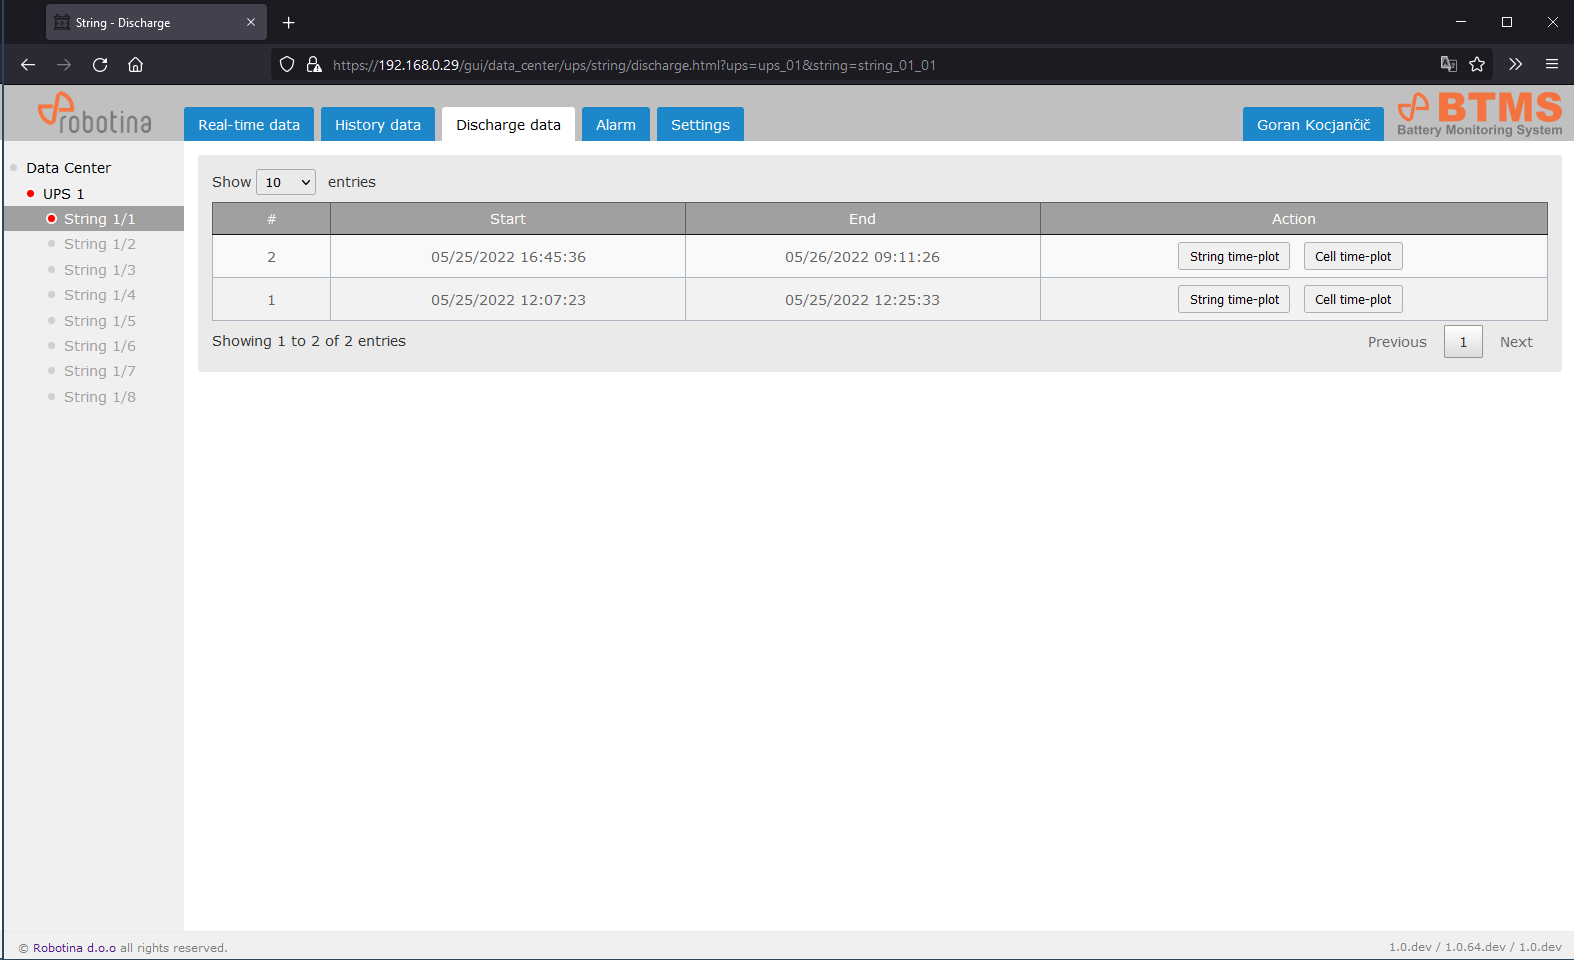
Discharge data
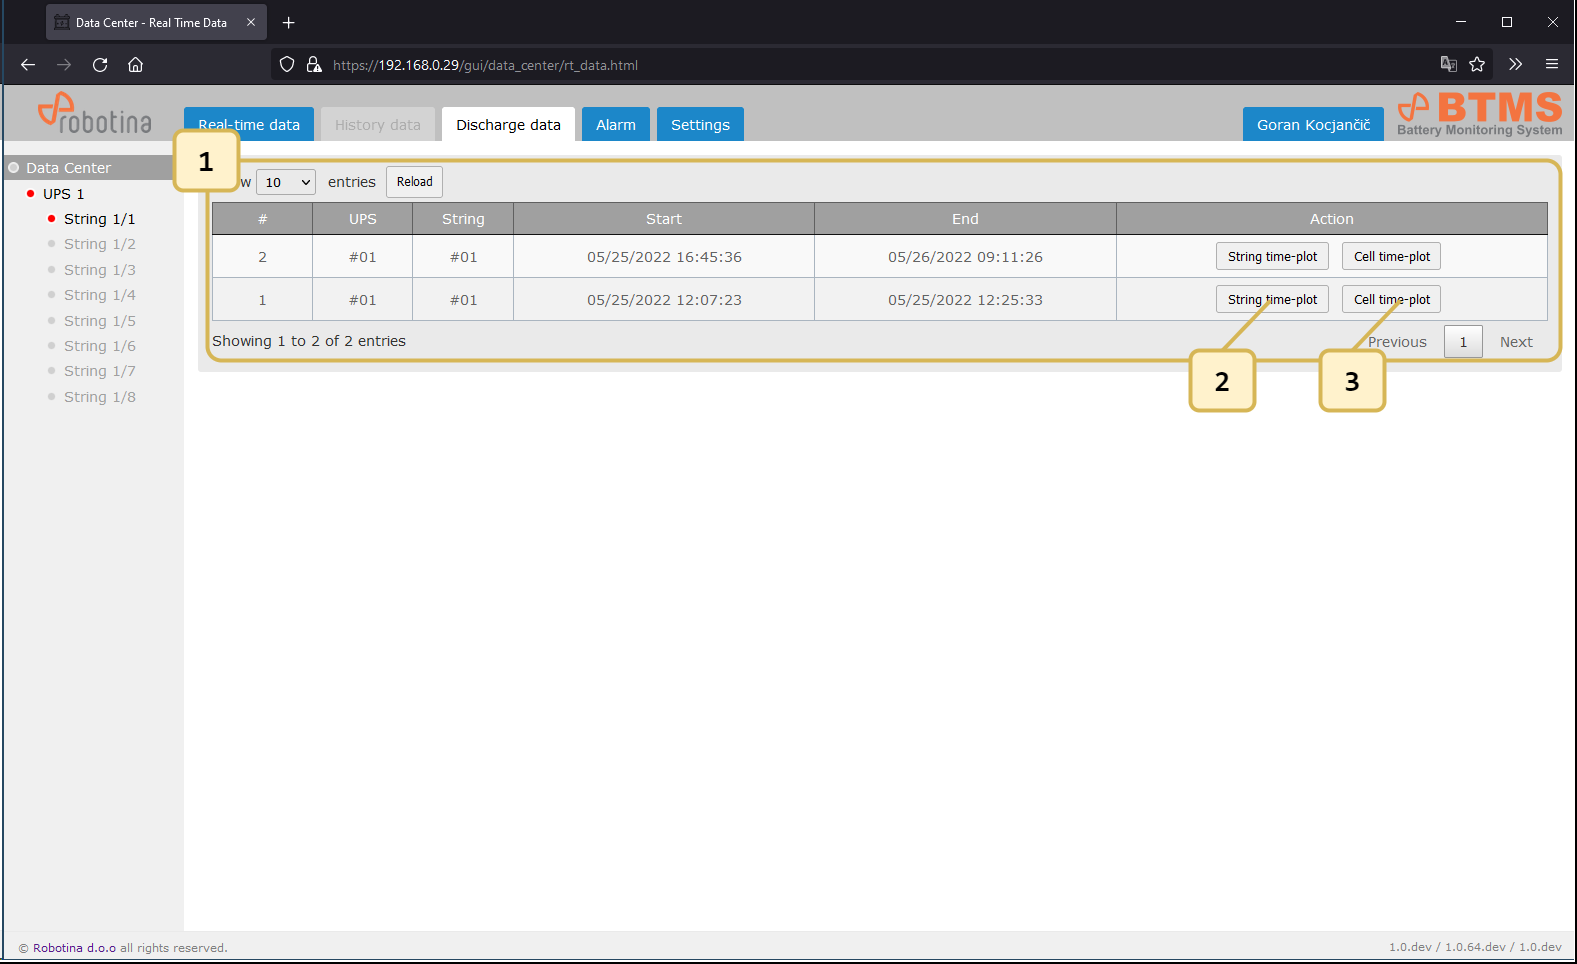
| 1 | Discharge events table |
|---|---|
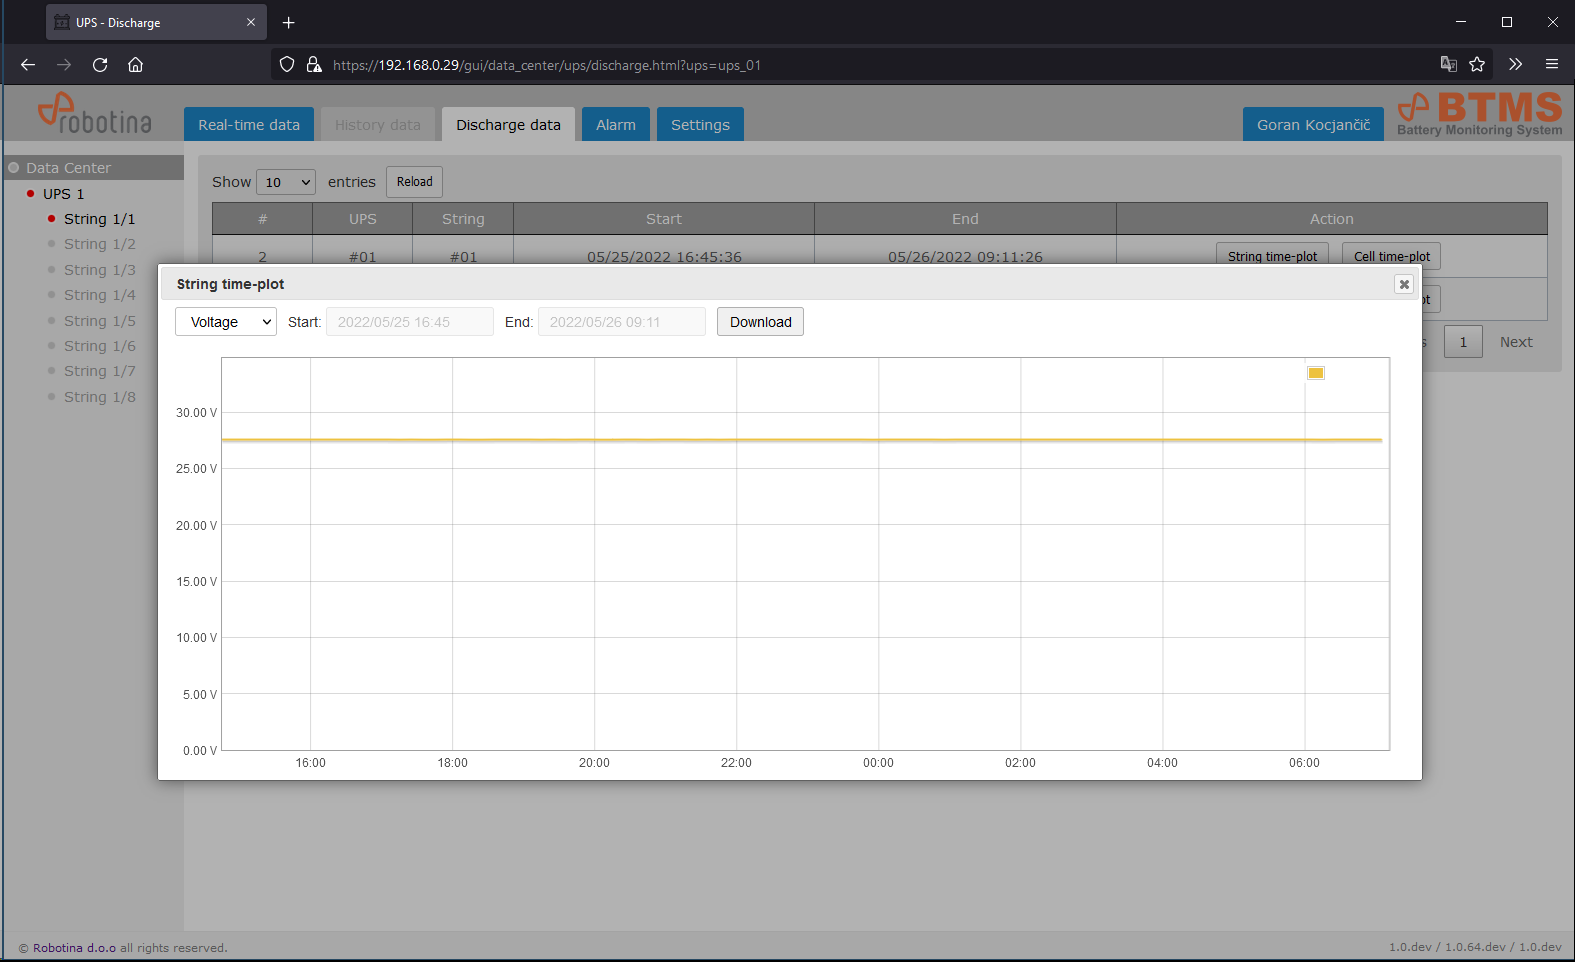
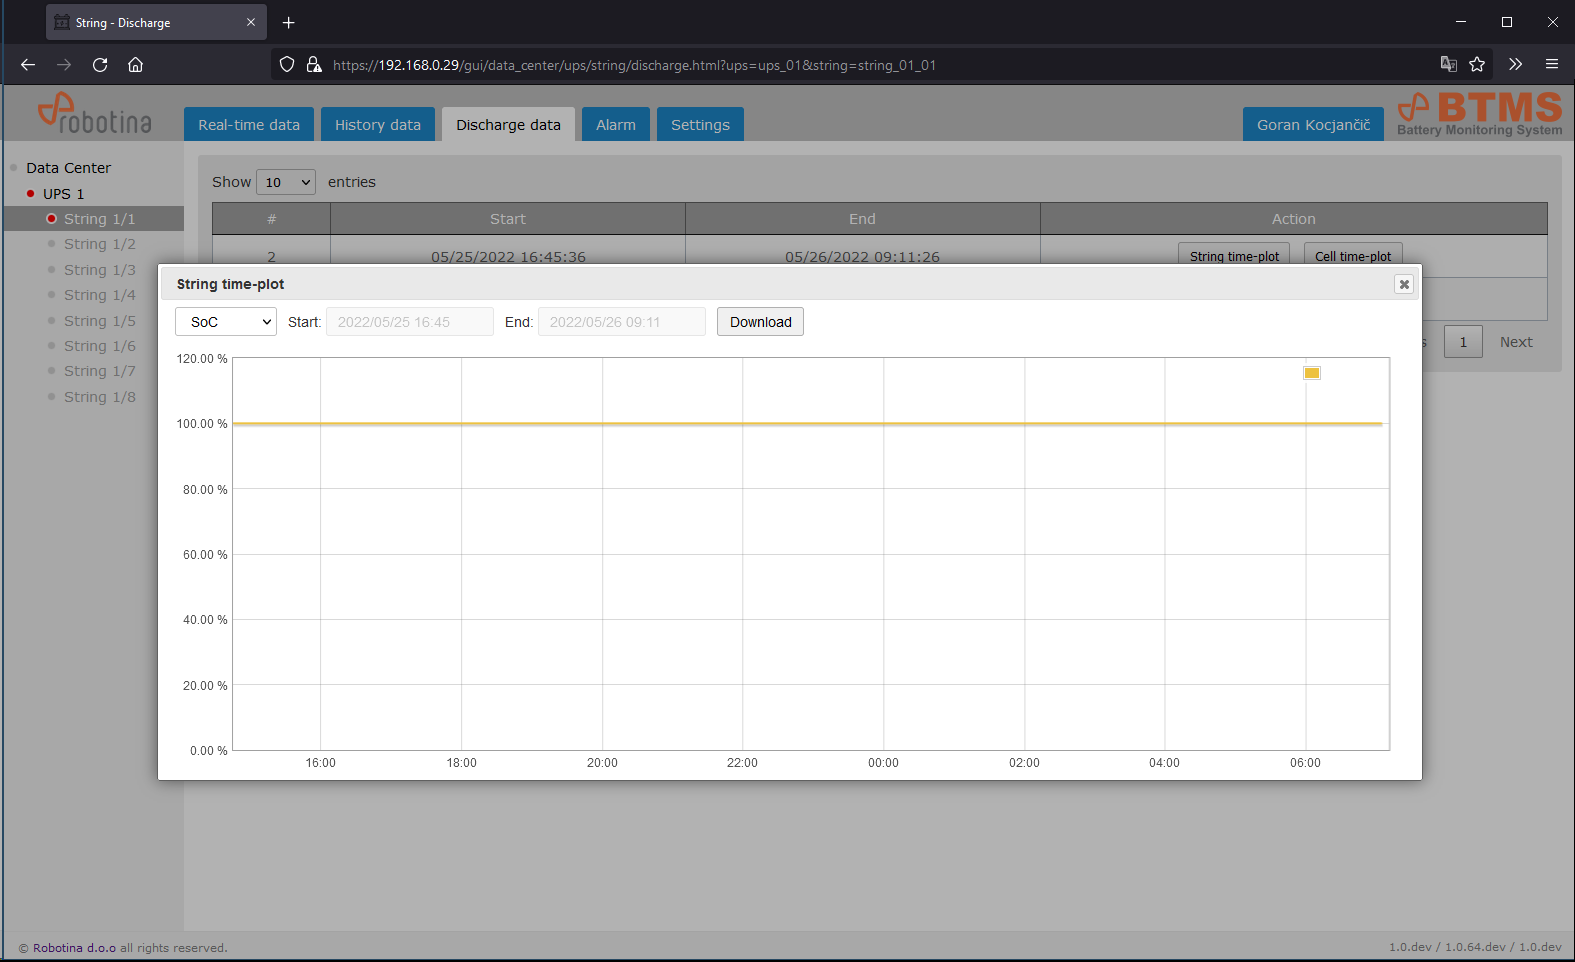
| 2 | String time-plot for discharge event |
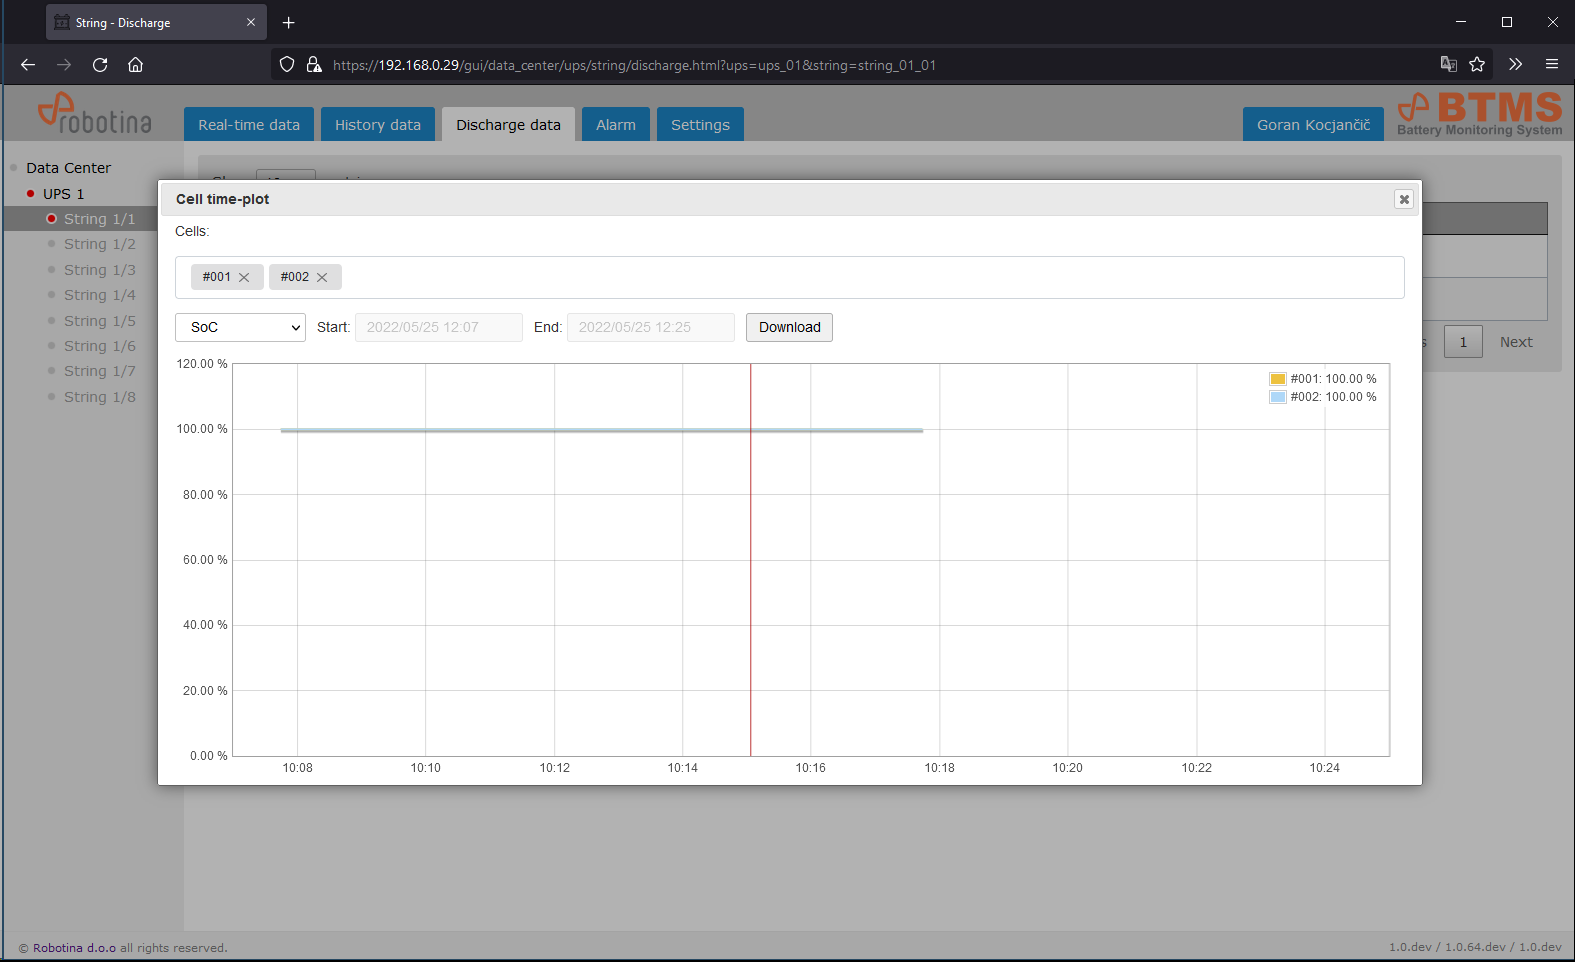
| 3 | Cell time-plot for discharge event |
String time-plot for discharge event
Cell time-plot for discharge event
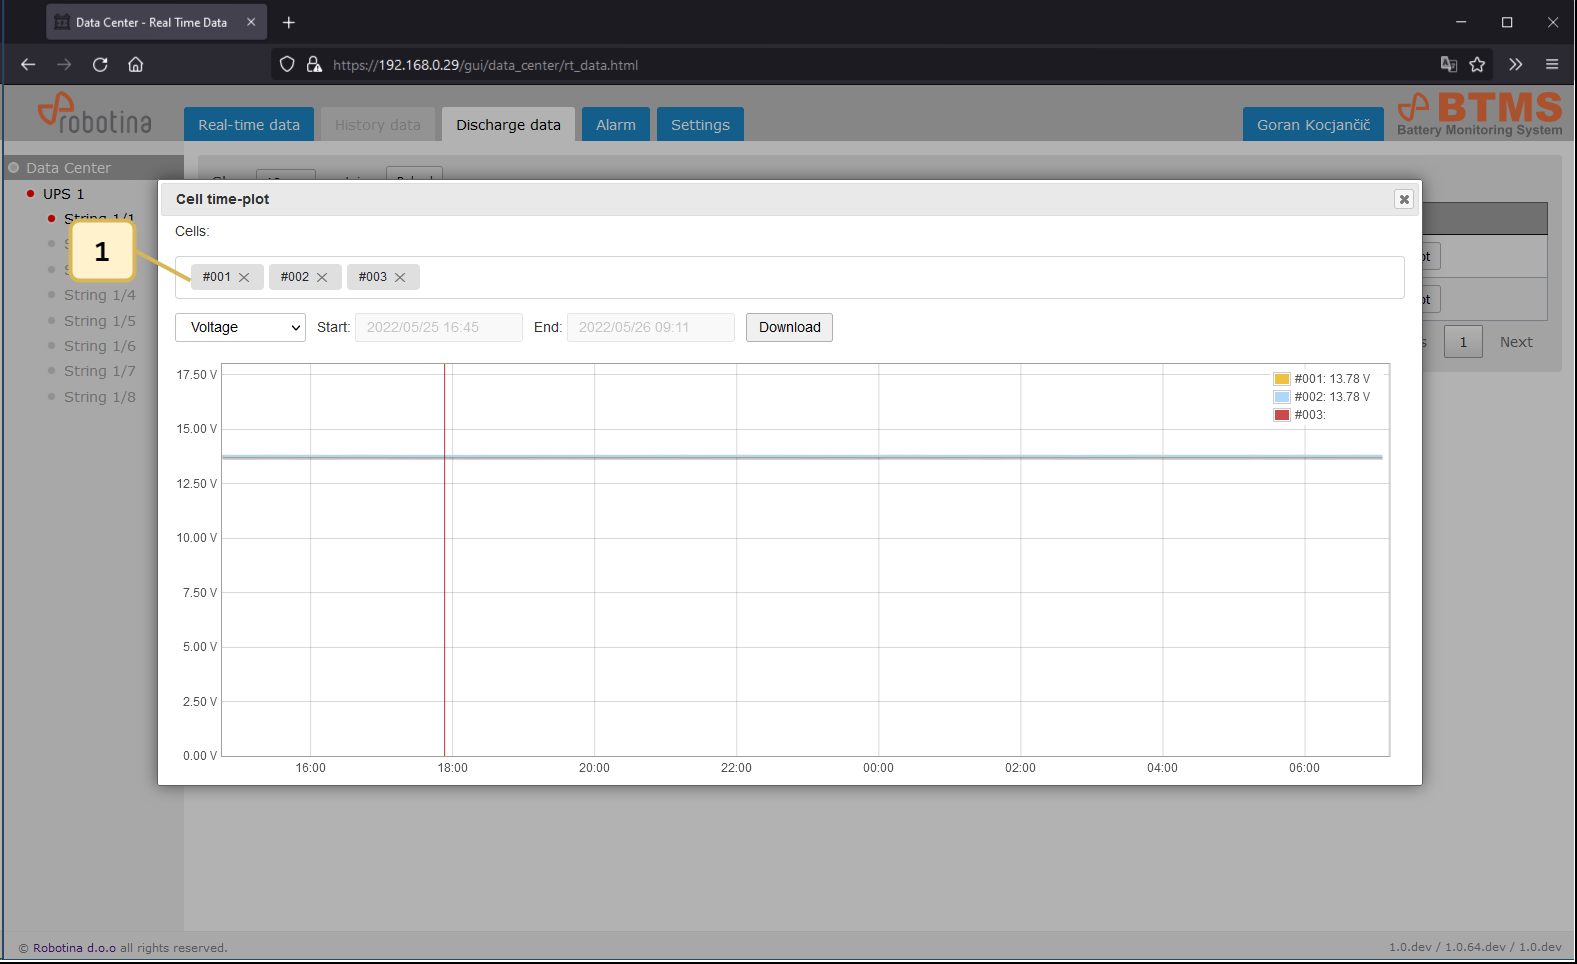
| 1 | Cell selection |
|---|
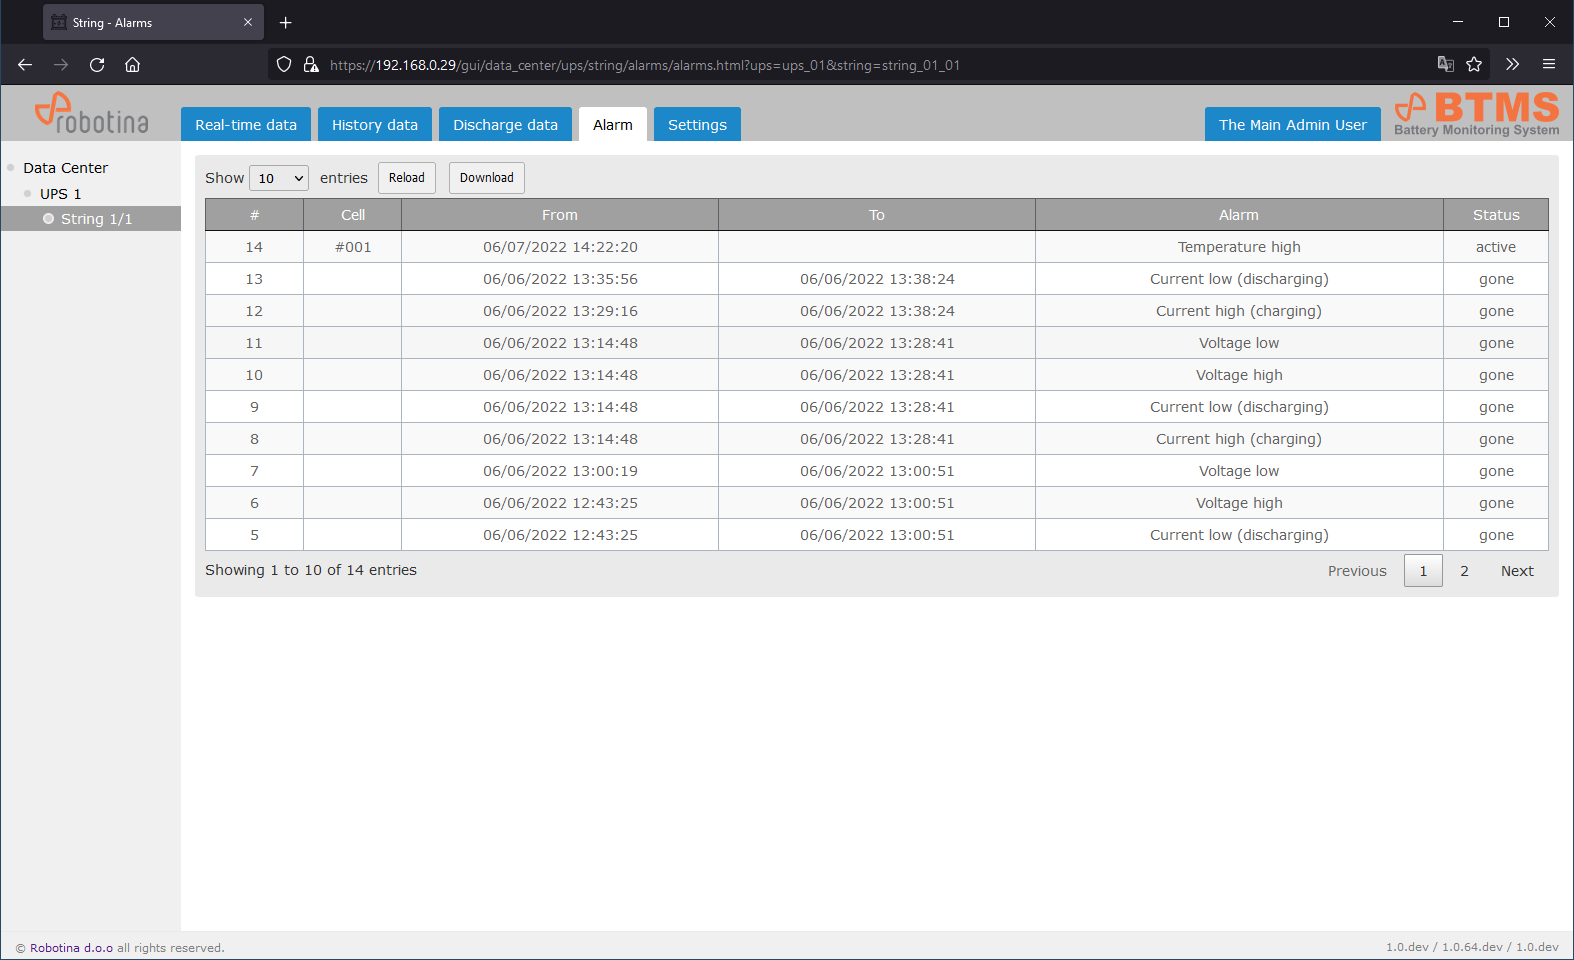
Alarm
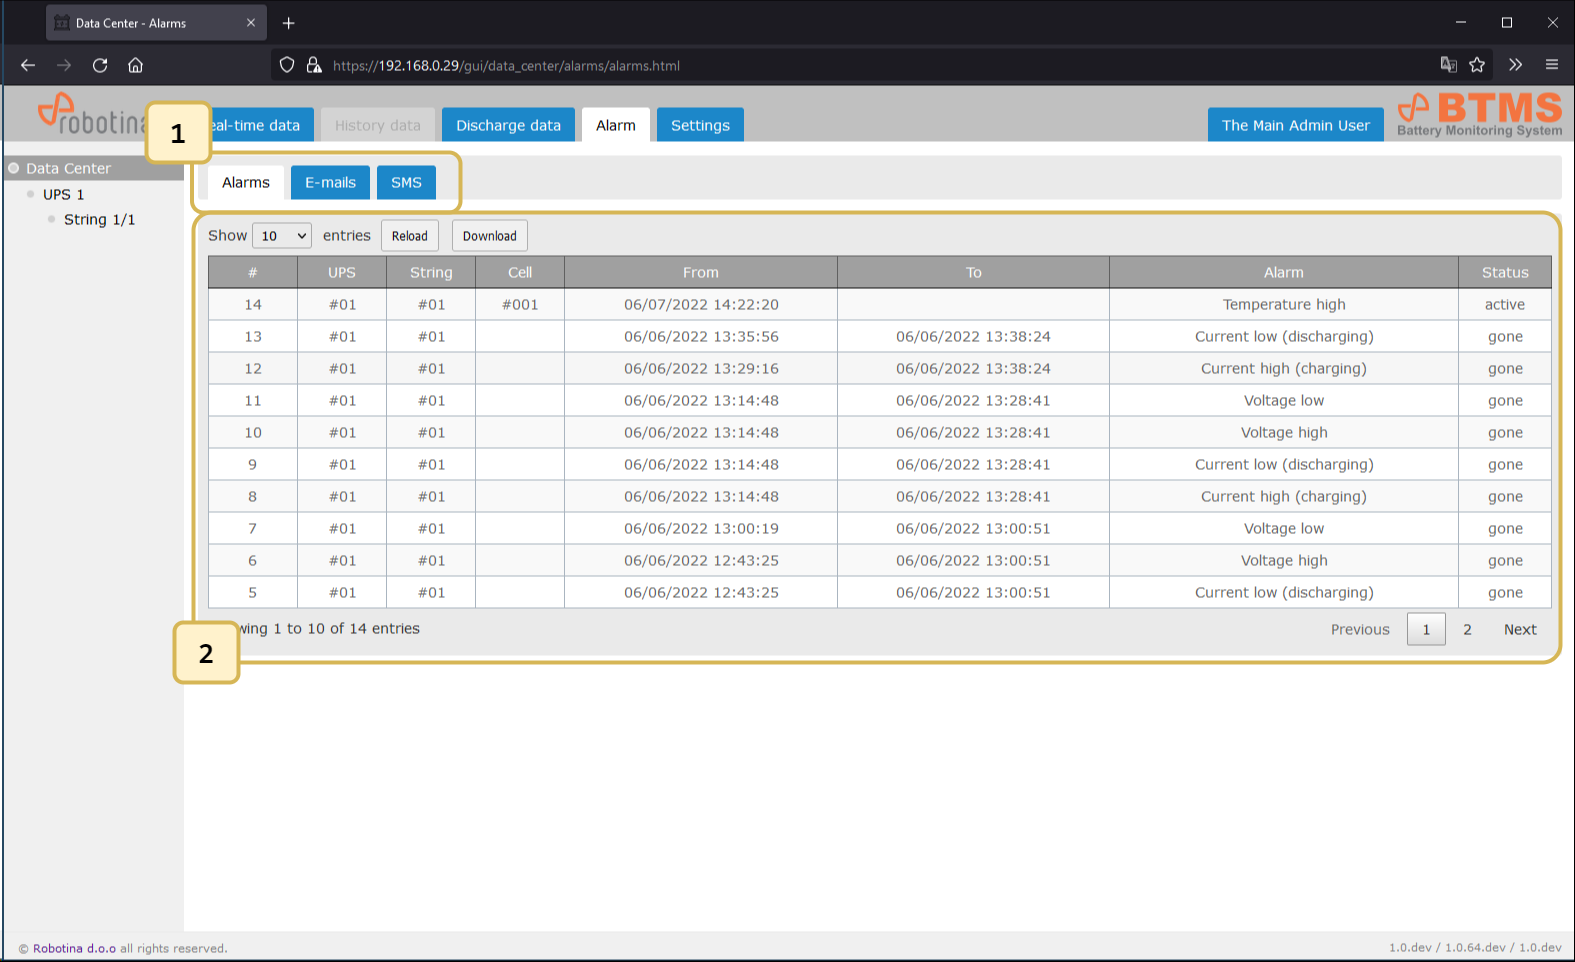
| 1 | Alarms sub-page selection |
|---|---|
| 2 | Alarms table |
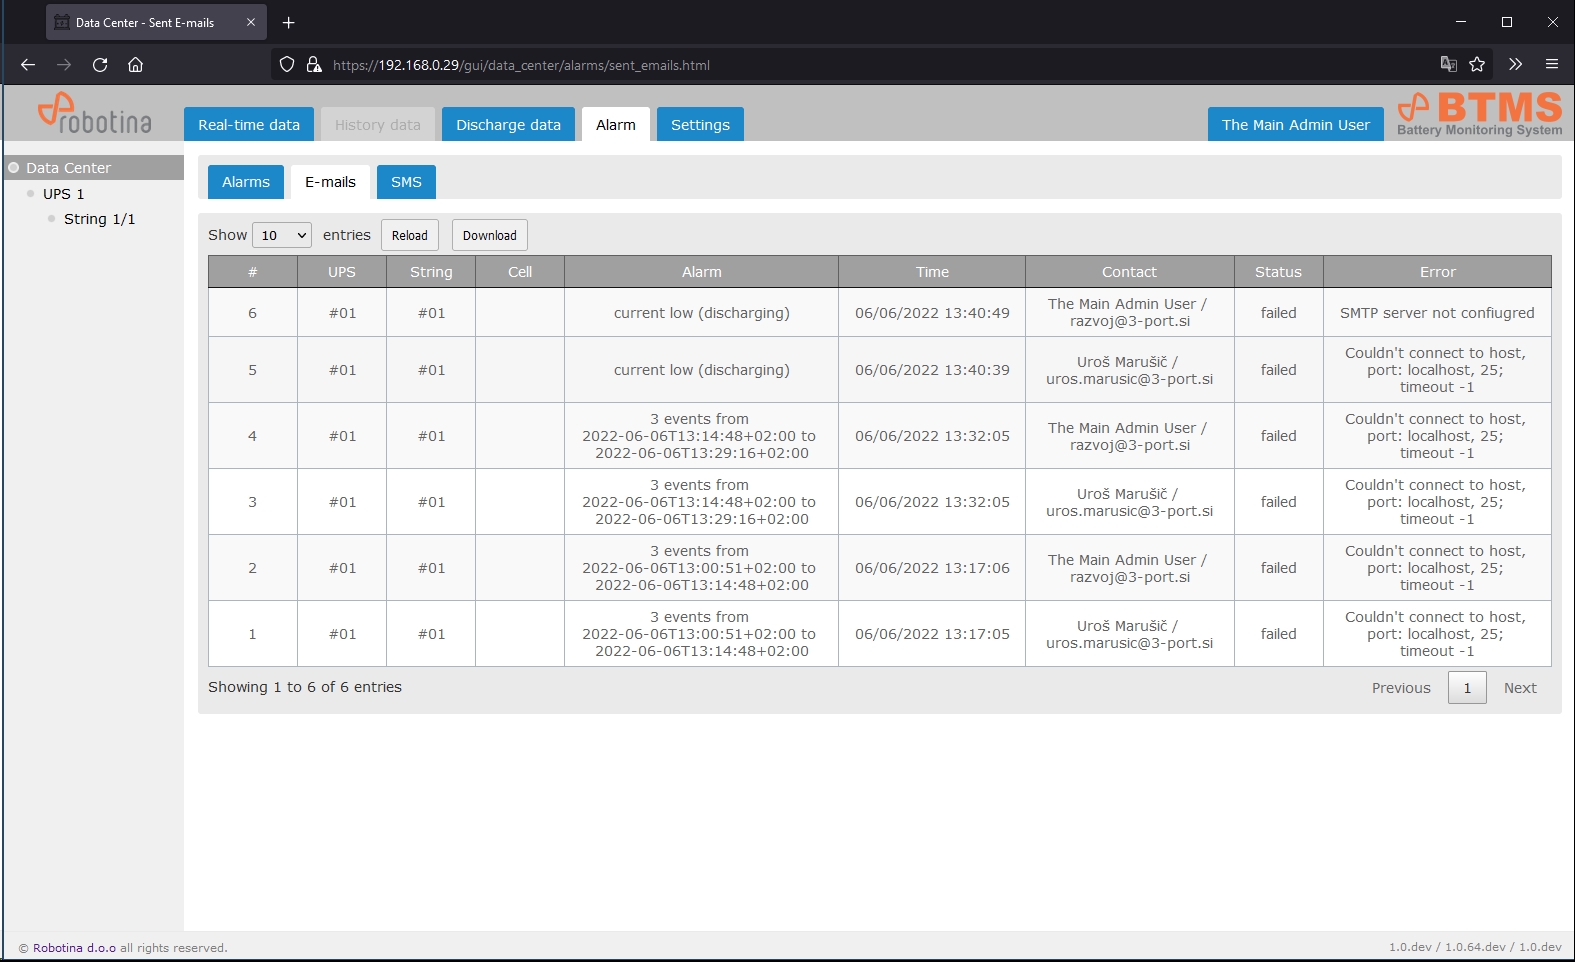
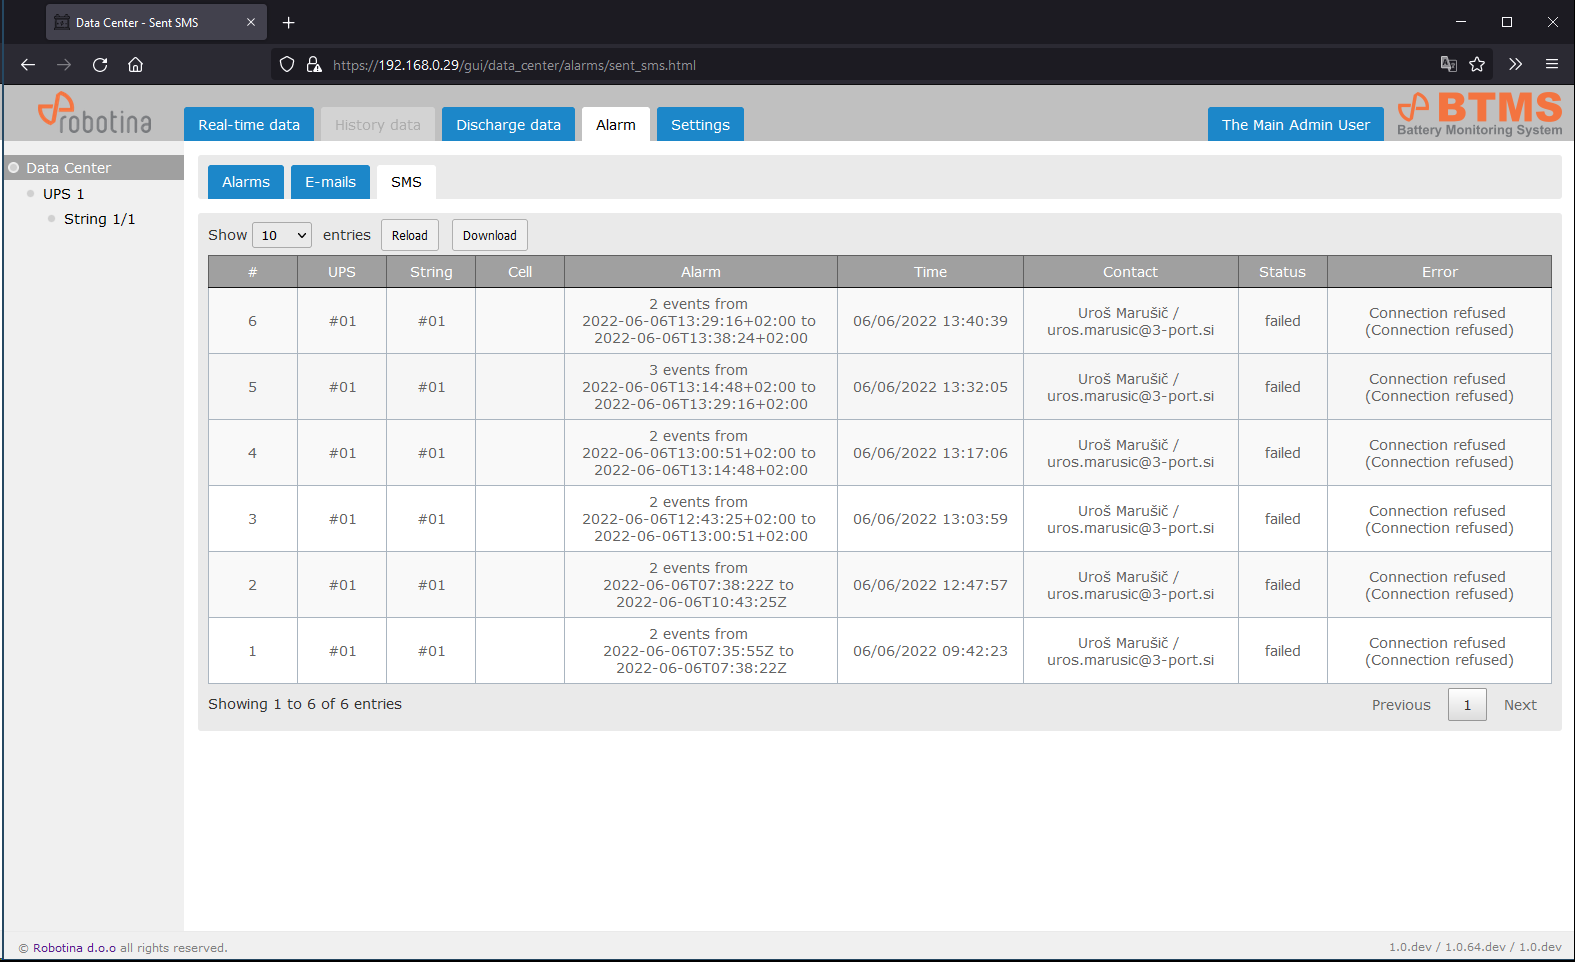
E-mails
SMS
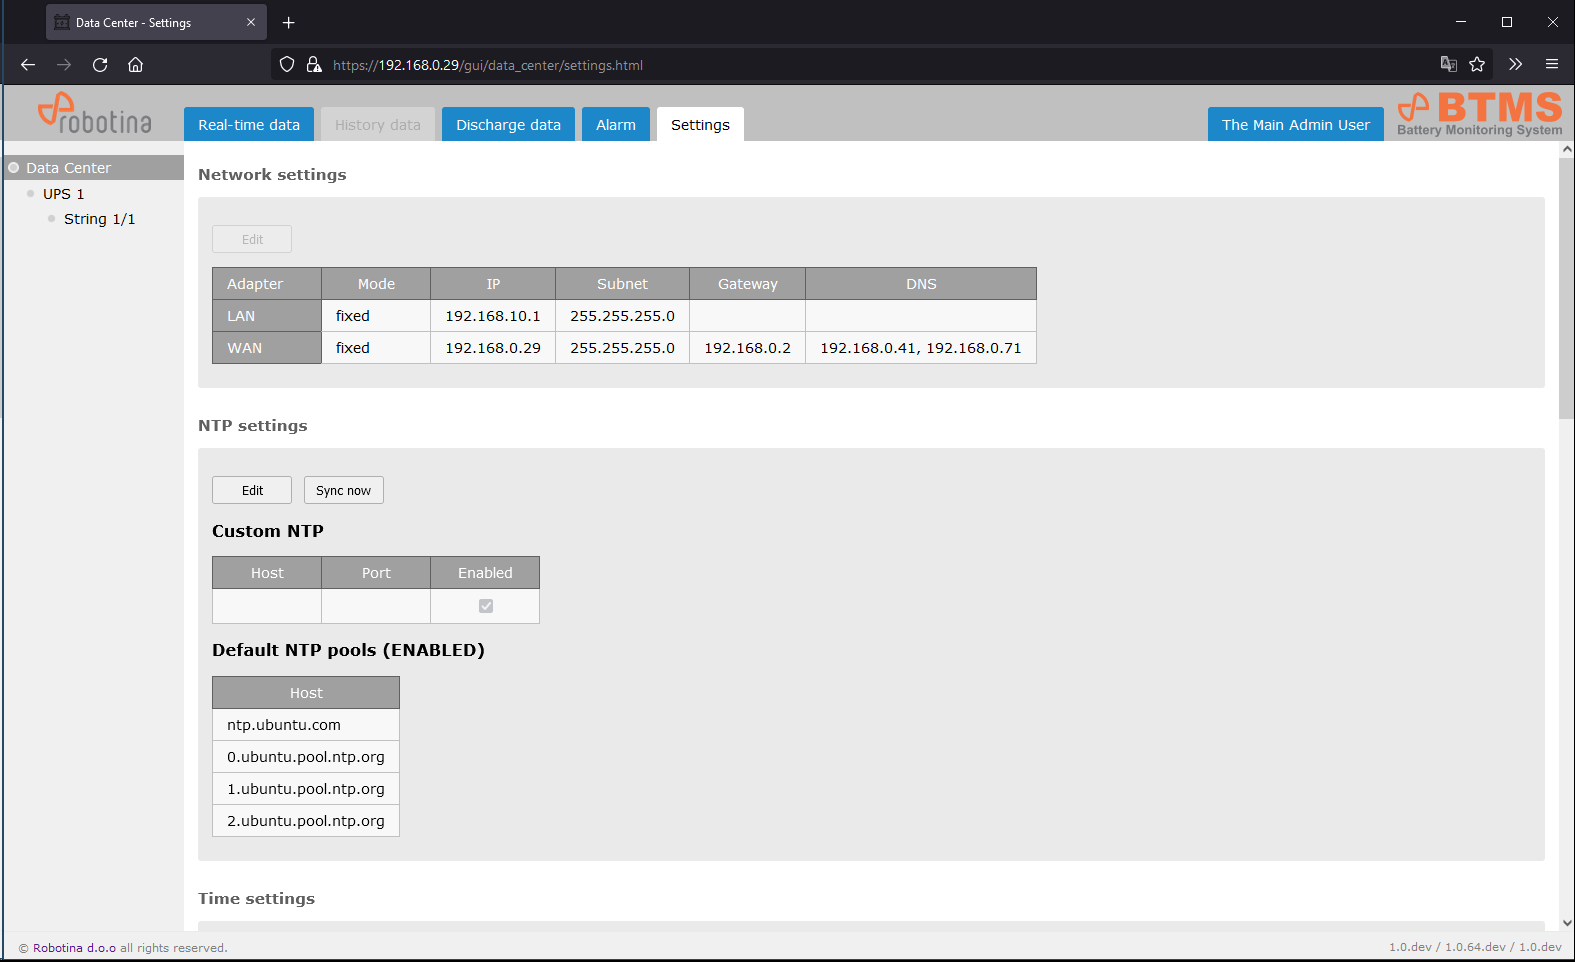
Settings
Network settings, NTP settings
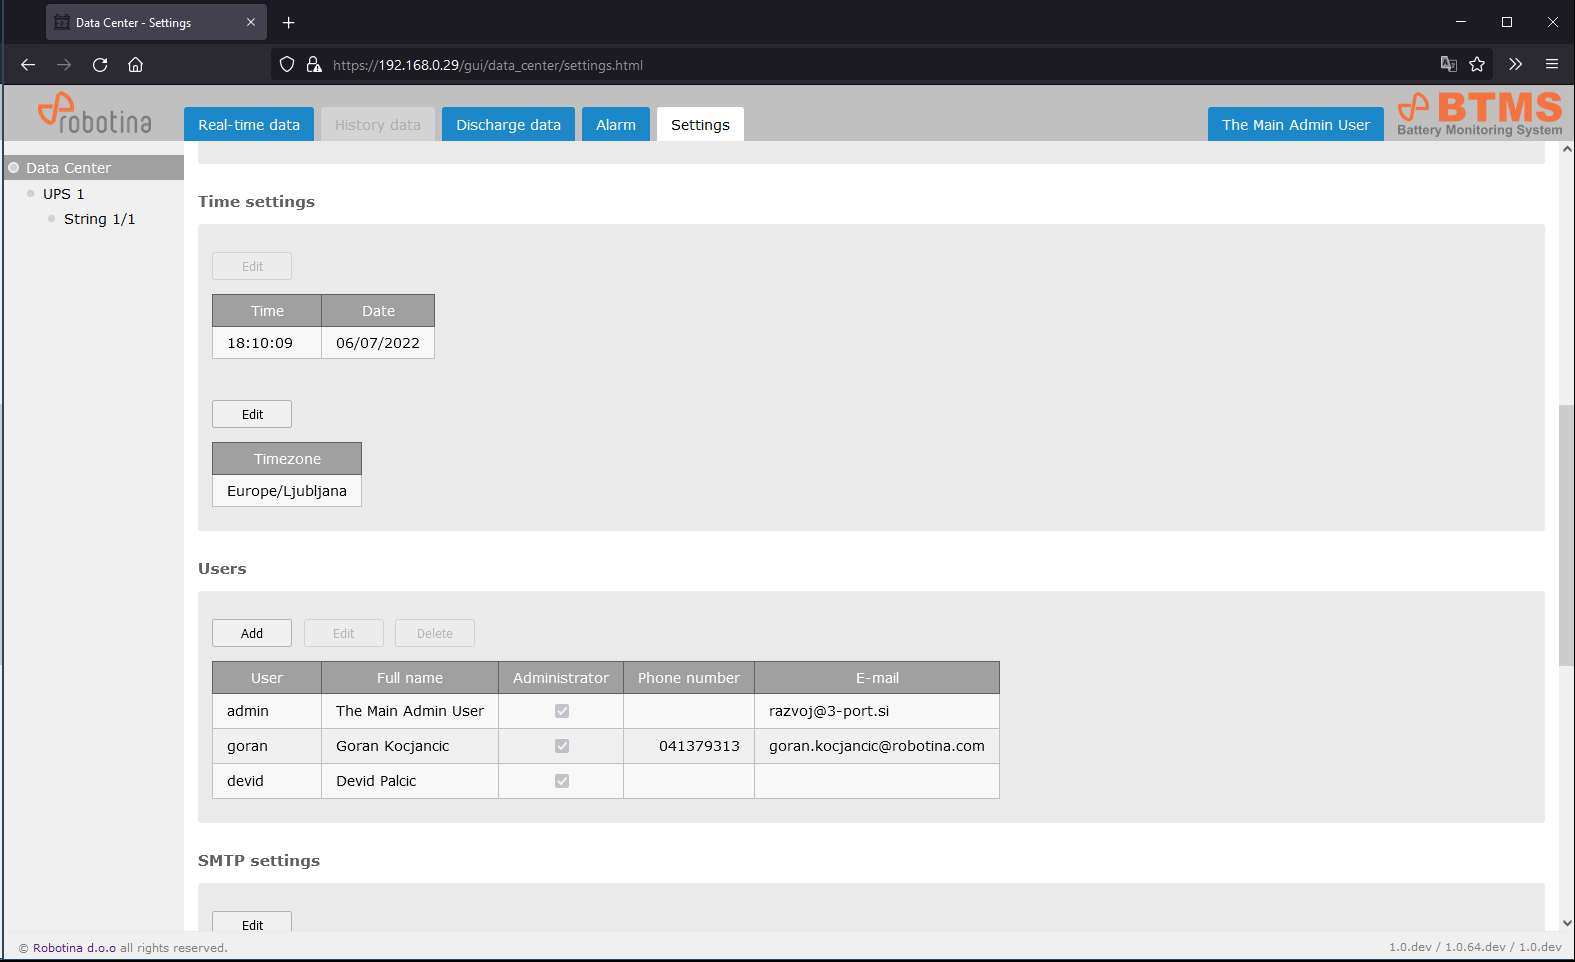
Time settings, Users
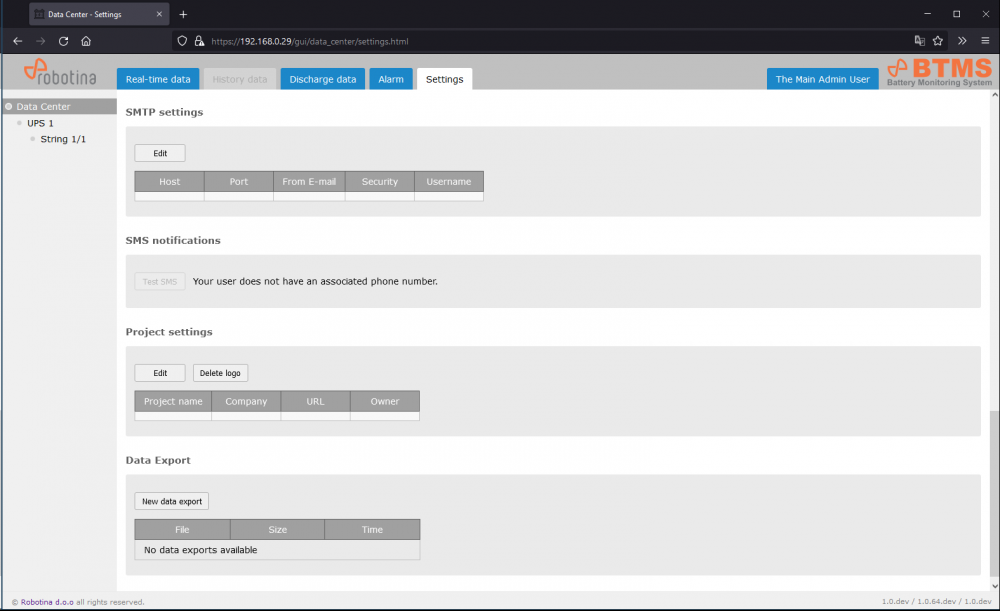
SNMP settings, SMS notifications, Project settings, Data export
UPS
Real-time data
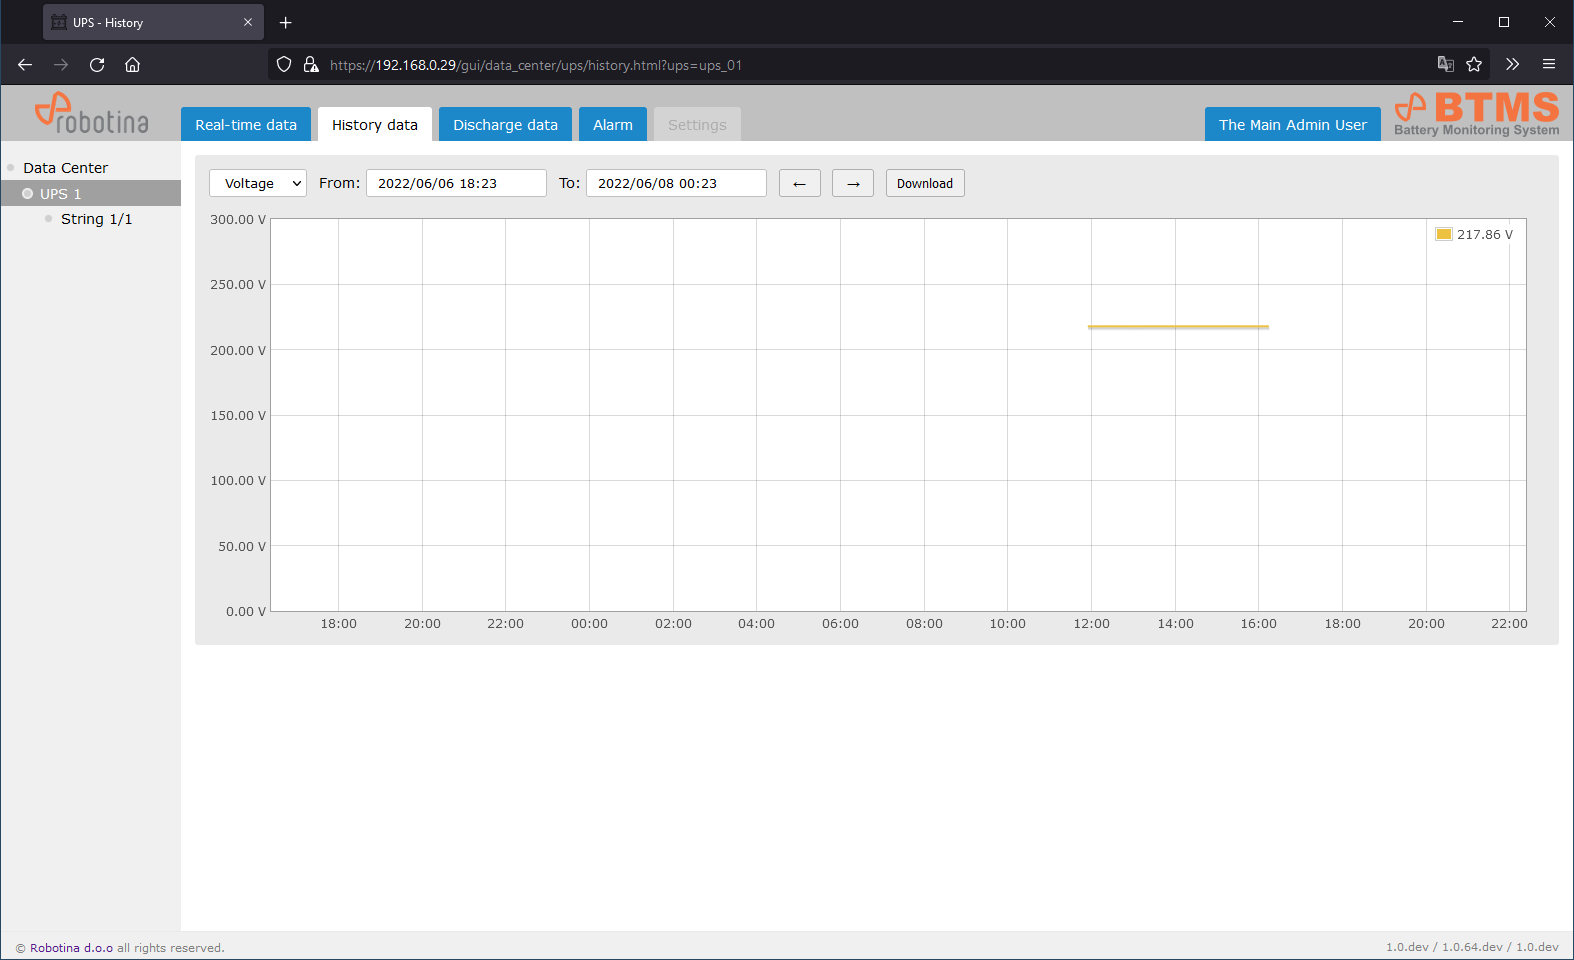
History data
Discharge data
String time-plot
Cell time-plot
Alarm

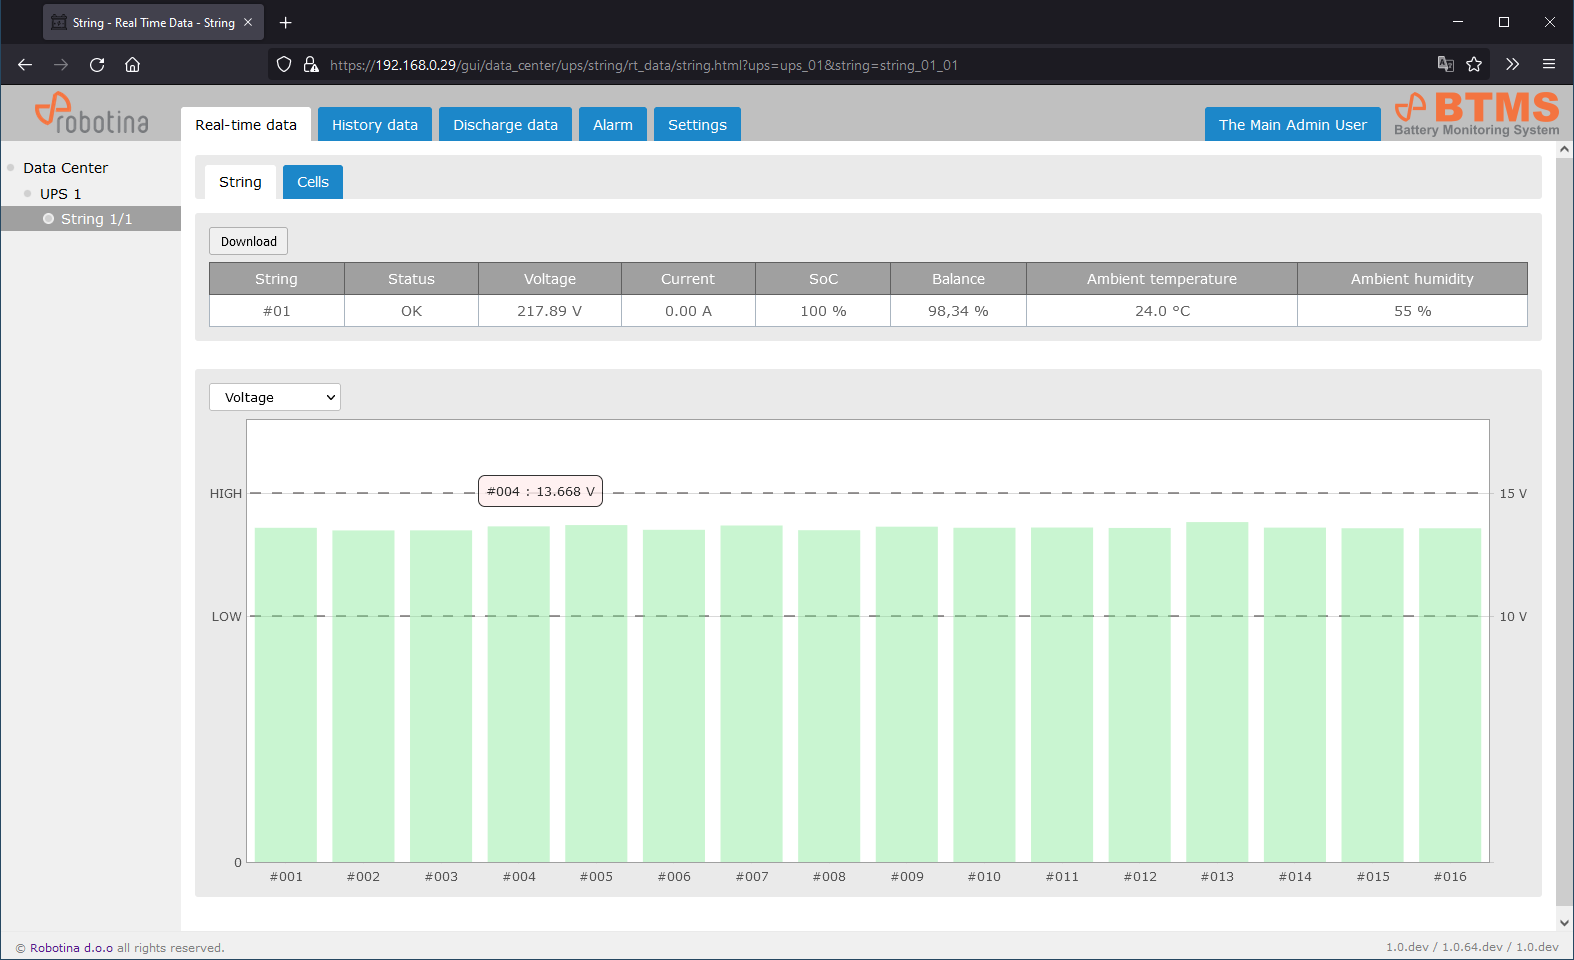
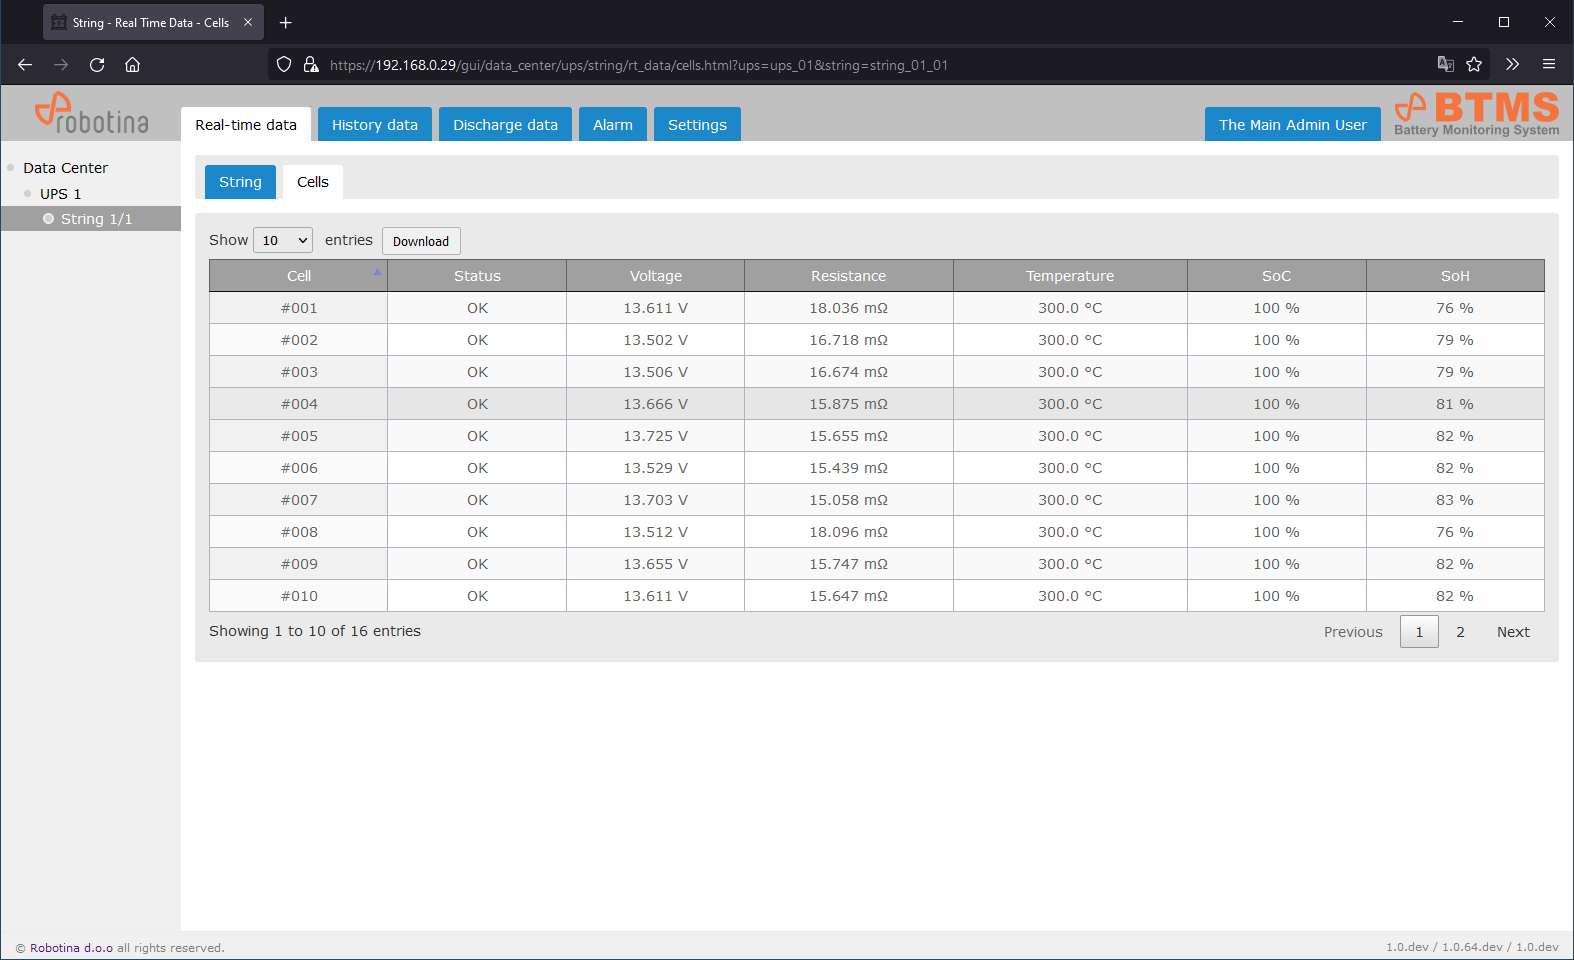
String
Real-time data
String
Cells
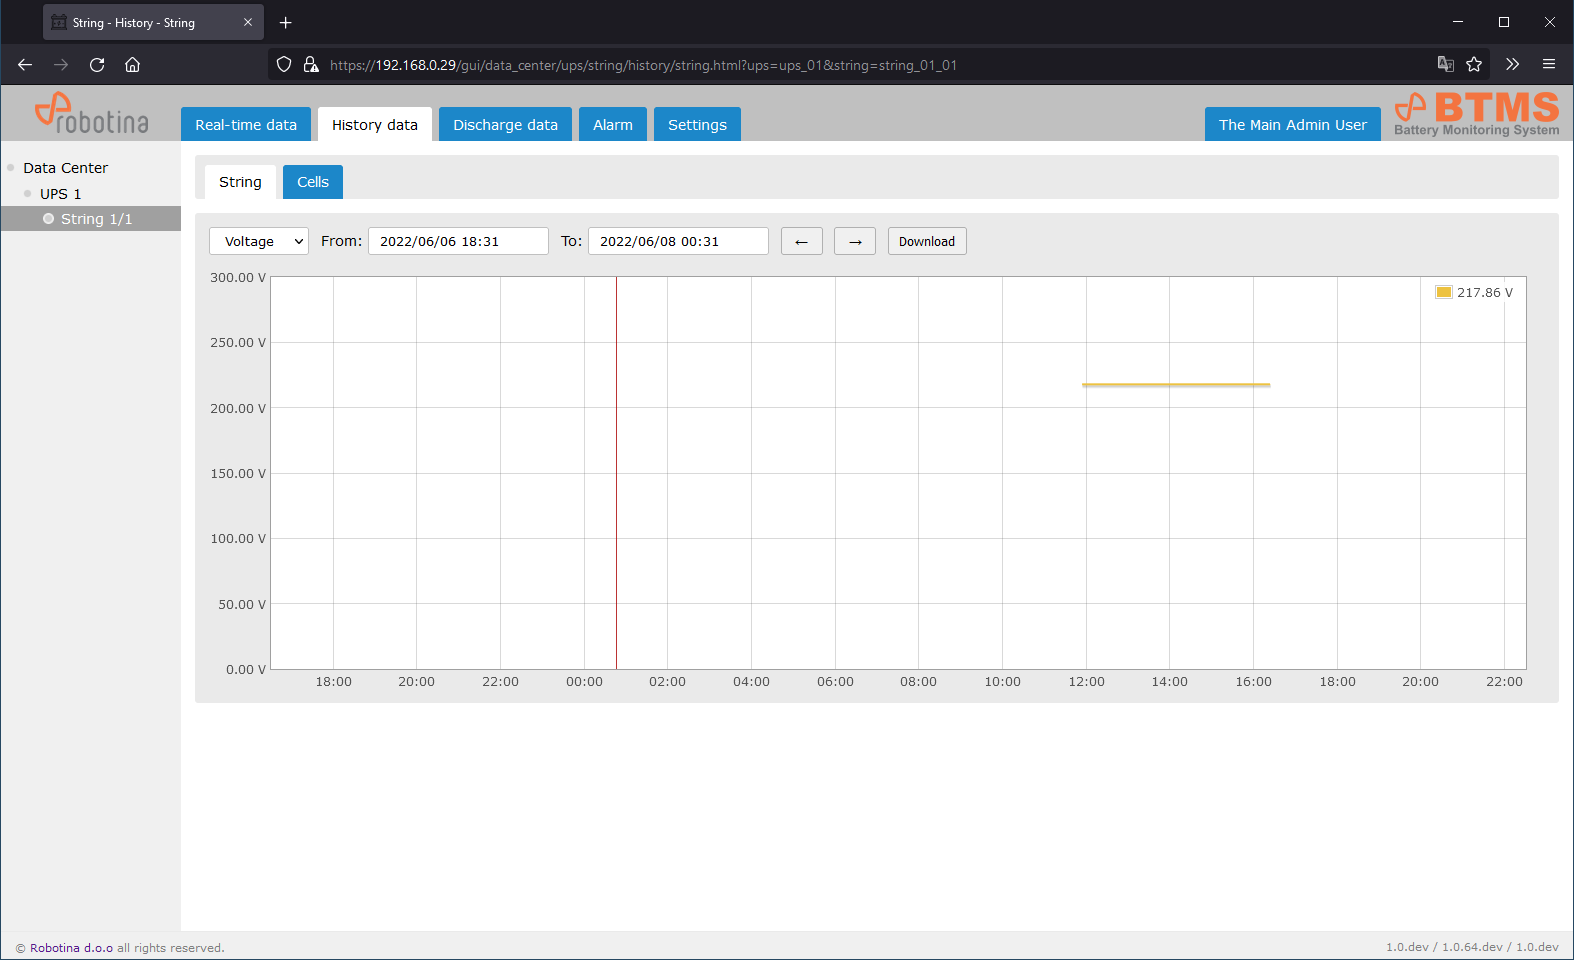
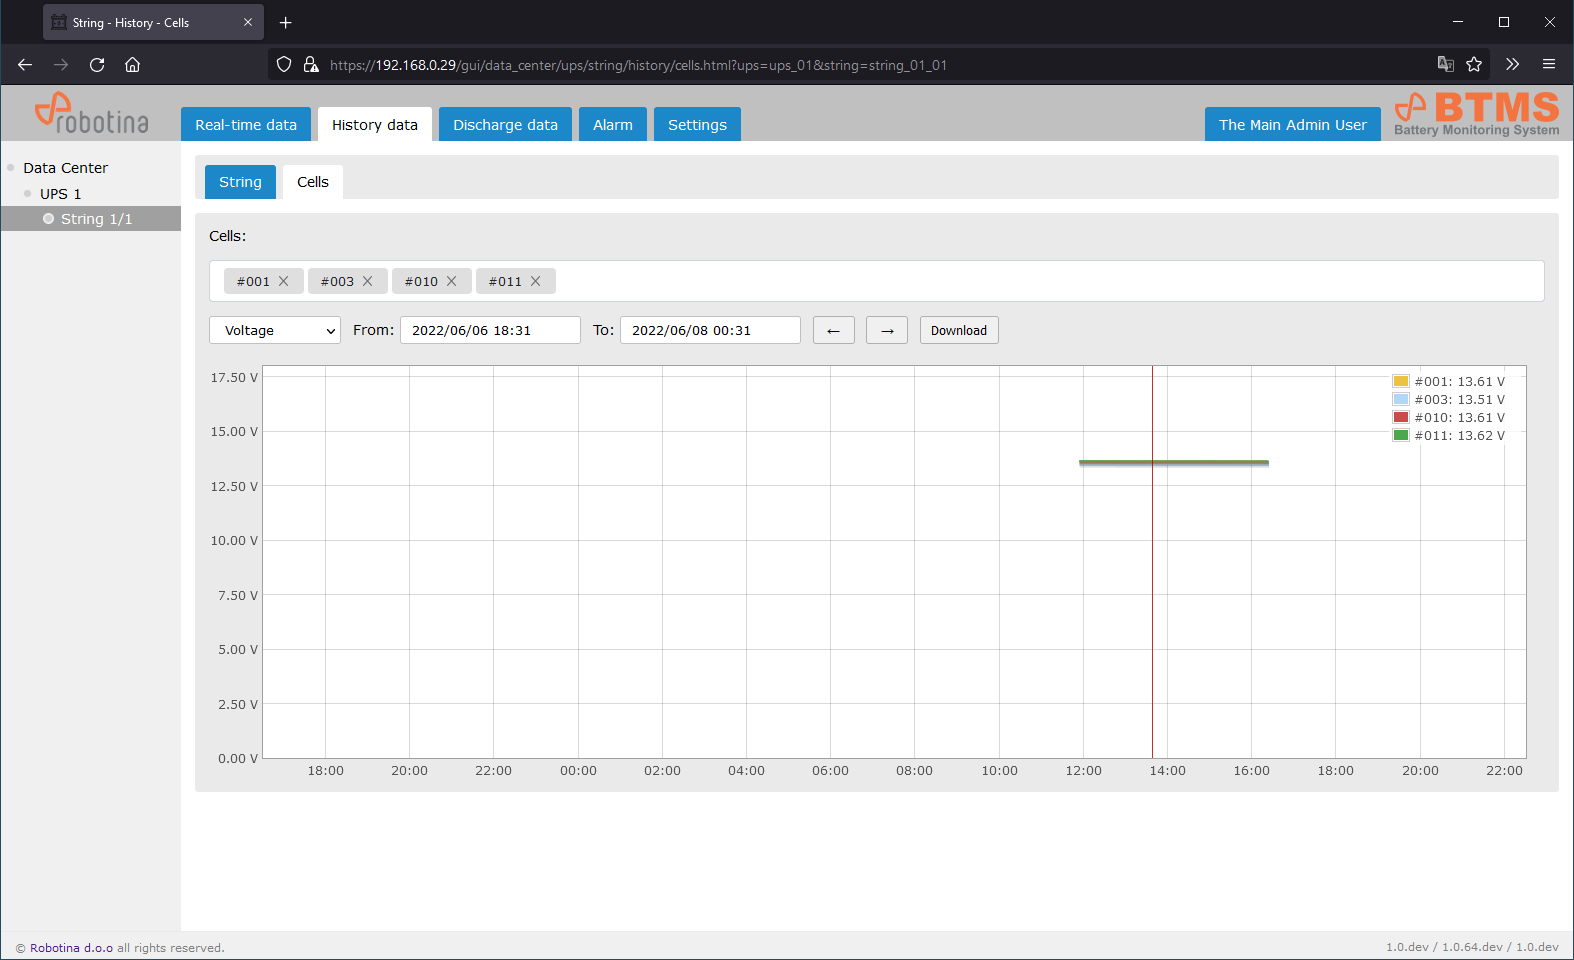
History data
String
Cells
Discharge data
String time-plot
Cell time-plot
Alarm
Settings

Enable for which alarm SMS / e-mail will be sent.